MindFusion.Charting for JavaScript

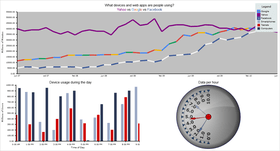
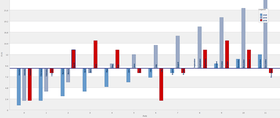
MindFusion.Charting for JavaScript combines 2D and 3D charts, financial graphs, gauges and dashboards. It includes an elegant API, a rich event set, unlimited number and type of data series and everything else you might need to create the perfect data visualization in JavaScript and HTML.

MindFusion.Charting for JavaScript Features

  • Support for All Common Chart Types - The JavaScript chart supports all popular chart types and their variations: pie, doughnut, bar, column, radar, polar, line, area, scatter, bubble, step charts. The elegant API allows you to combine series of different types on a single plot. You can also add unlimited number of legends, a title and a subtitle, labels on various chart elements.
  • 3D Bar Charts in JavaScript - MindFusion uses WebGL to create 3D bar...

最新新聞

MindFusion.Charting for JavaScript V2.0
January 13, 2022新版本
區域圖現在相對於軸原點進行呈現。
MindFusion.Charting for JavaScript 1.2
August 24, 2020新版本
添加指定圖表軸原點的功能。

價格從: US$ 294.00

Developer License - Licenses are perpetual。 One license is required per developer。 You are NOT required to pay any additional distribution, runtime, royalty, or per-end-user license fees。 Site-wide...

MindFusion.Charting for JavaScript 也以___提供︰

有任何疑問嗎?

Live Chat現在與我們的MindFusion Group 專家即時聊天詢問。

MindFusion Group
作為官方授權的代理商,ComponentSource 可為您提供MindFusion Group的正版授權。
Component Type
  • JavaScript
  • jQuery

最近獲得的獎項

PublisherPublisherPublisher