Vizuly Venn Diagram

將 Venn 關係圖圖表添加到您的 JavaScript 應用中。

由以下開發商製作:Vizuly
ComponentSource 開始代理銷售的日期:2019年

價格從: $ 57.82 版本: 2.1.219 更新: Jun 7, 2019

i

Vizuly Professional includes all Vizuly components at a significant discount.

Vizuly Venn Diagram

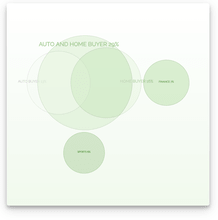
Vizuly Venn Diagram shows all possible logical relations between a finite collection of different sets. This chart depicts elements as points in the plane, and sets as regions inside closed curves. A Venn diagram consists of multiple overlapping closed curves, usually circles, each representing a set. Using data bound dynamic styles you can declare different colors and visual attributes unique to each set.

Features

  • 6 example themes
  • Several dynamic styles
  • Adjustable properties and interactive event support
  • Customizable Data Tips
  • Documentation

Framework Adapters

  • React Adapters
  • Angular Adapters
  • Vue.js Adapters

最新新聞

Vizuly Venn 圖關係發佈
Vizuly Venn 圖關係發佈
June 7, 2019新產品
將 Venn 關係圖圖表添加到您的 JavaScript 應用中。

價格從: $ 57.82

Vizuly Developer Licensing: Developer License allows a single developer to use the Software on an unlimited number of websites, intranets, web applications and SaaS projects, Developer License allows...

Vizuly Venn Diagram 也以___提供︰

有任何疑問嗎?

Live Chat現在與我們的Vizuly 專家即時聊天詢問。

Vizuly
作為官方授權的代理商,ComponentSource 可為您提供Vizuly的正版授權。
構件類型
  • JavaScript
  • 反應
  • vue. js