













官方供應商
我們作為官方授權經銷商,直接提供超過200家開發廠家所發行超過1000個的產品授權給您。
請參閱我們所有的品牌。
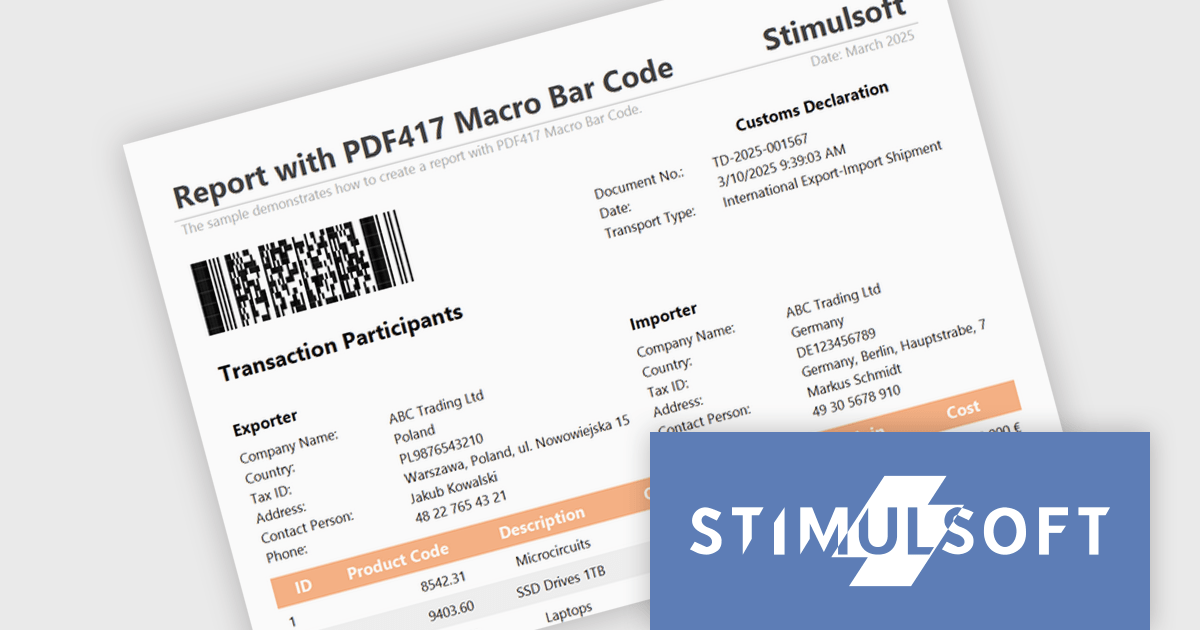
Stimulsoft Reports.JS provides a robust reporting toolkit designed specifically for JavaScript applications. This library leverages a client-side architecture, offering a pure JavaScript report engine for efficient report rendering directly within web browsers. The solution includes a user-friendly report designer for building reports with various data sources and visualizations, along with a report viewer for seamless integration and display within your JavaScript applications. This eliminates the need for server-side dependencies or browser plugins, simplifying the development process for embedding powerful reporting functionalities into your web projects.
The Stimulsoft Reports.JS 2025.2.1 update introduces support for the Macro PDF417 barcode, allowing developers to handle larger data payloads within reports. Unlike the standard PDF417 barcode, which is limited in data capacity, the Macro PDF417 format enables the encoding of large data files by splitting them into multiple linked symbols. This enhancement is particularly useful when working with high-volume or multi-page reports, providing a reliable solution for encoding structured data without compromising layout or readability.
To see a full list of what's new in 2025.2.1, see our release notes.
Stimulsoft Reports.JS is licensed per developer and is available as a Perpetual license with 1 year support and maintenance. See our Stimulsoft Reports.JS licensing page for full details.
Stimulsoft Reports.JS is available individually or as part of Stimulsoft Ultimate.
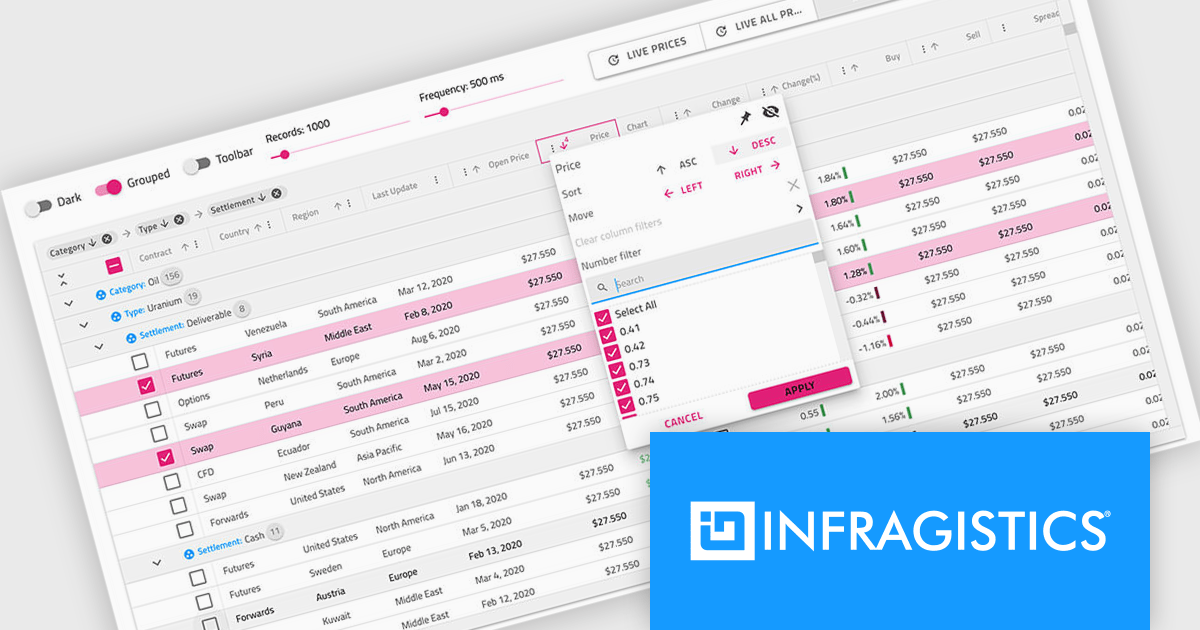
Infragistics Professional is a comprehensive toolkit for software developers, offering a wide range of pre-built, high-performance UI components for building visually appealing and feature-rich applications across Angular, React, Web Components, Blazor, ASP.NET MVC, ASP.NET Core, Windows Forms, WPF and Xamarin. It includes controls such as data grids, charts, navigation menus, and more, along with productivity tools to streamline development processes.
Infragistics Professional delivers a powerful Angular Data Grid Component that enables developers to efficiently display, manage, and interact with large datasets in modern web applications. Designed for performance and scalability, it offers advanced features such as editing, sorting, filtering, and data export, all seamlessly integrated into the Angular framework. This allows developers to build responsive, real-time data experiences that meet the demands of enterprise-grade applications.
Infragistics Professional is licensed per developer and is available as a Perpetual License with a 1, 2 or 3 year support and maintenance subscription. See our Infragistics Professional licensing page for full details.
The Ignite UI for Angular Data Grid is available in the following products:
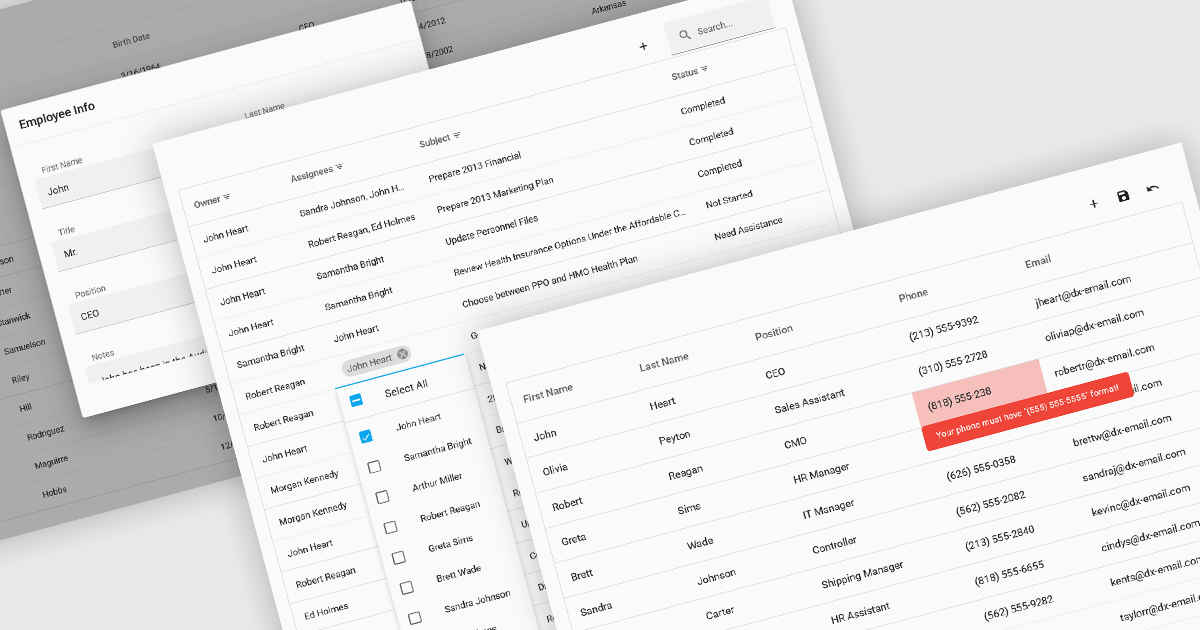
Data interaction and manipulation features in grid components enable users to engage directly with tabular data—supporting not just the display of information, but also its editing, validation, and contextual input. These capabilities are critical for creating rich, form-like experiences within data grids, particularly in applications where user input and data integrity are central to the workflow. By offering a range of editing modes and validation tools, grid components help ensure that data remains both accessible and accurate, enabling intuitive and efficient user interactions.
Common grid editing and validation features include:
For an in-depth analysis of features and price, visit our React grid components comparison.
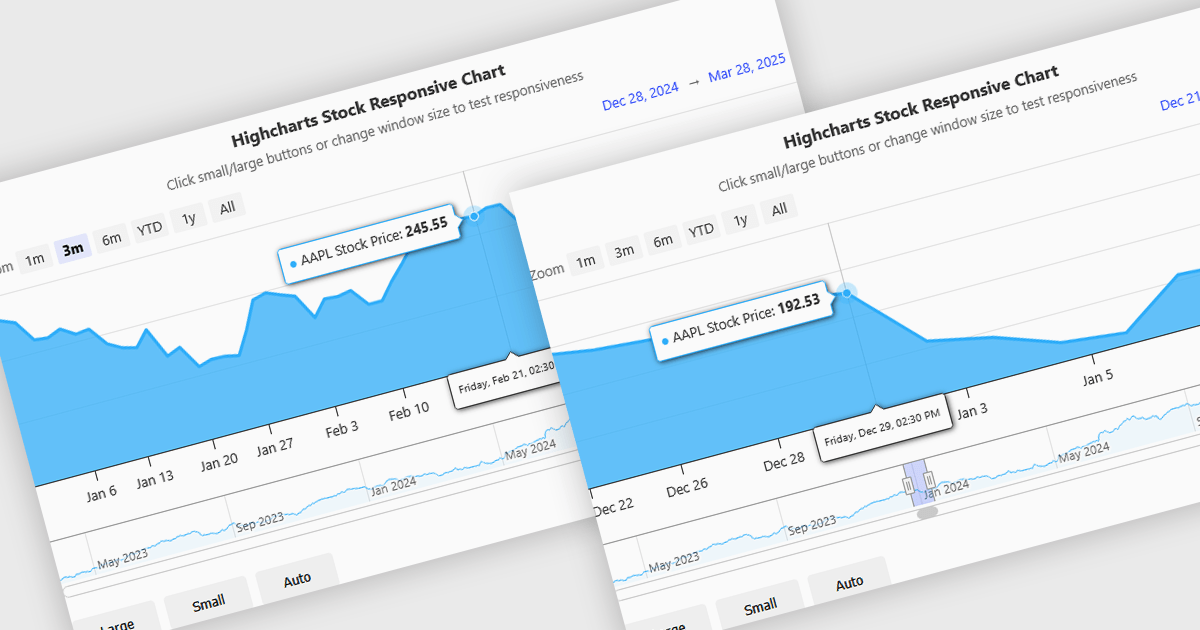
Responsive behavior in chart controls refers to the automatic adjustment of a chart’s layout, dimensions, and visual elements to fit the screen size or container in which it is rendered. This functionality ensures that charts remain readable and usable across a wide range of devices, from desktops to tablets and smartphones, without requiring manual configuration for each format. The benefits include reduced development overhead, improved user experience, and consistent presentation of data regardless of platform. Common use cases include dashboards in web applications, analytics platforms, and mobile-first reporting tools, where users expect seamless interaction and clear data visualization across multiple device types.
Several JavaScript chart controls support responsive behavior, including:
For an in-depth analysis of features and price, visit our JavaScript chart controls comparison.
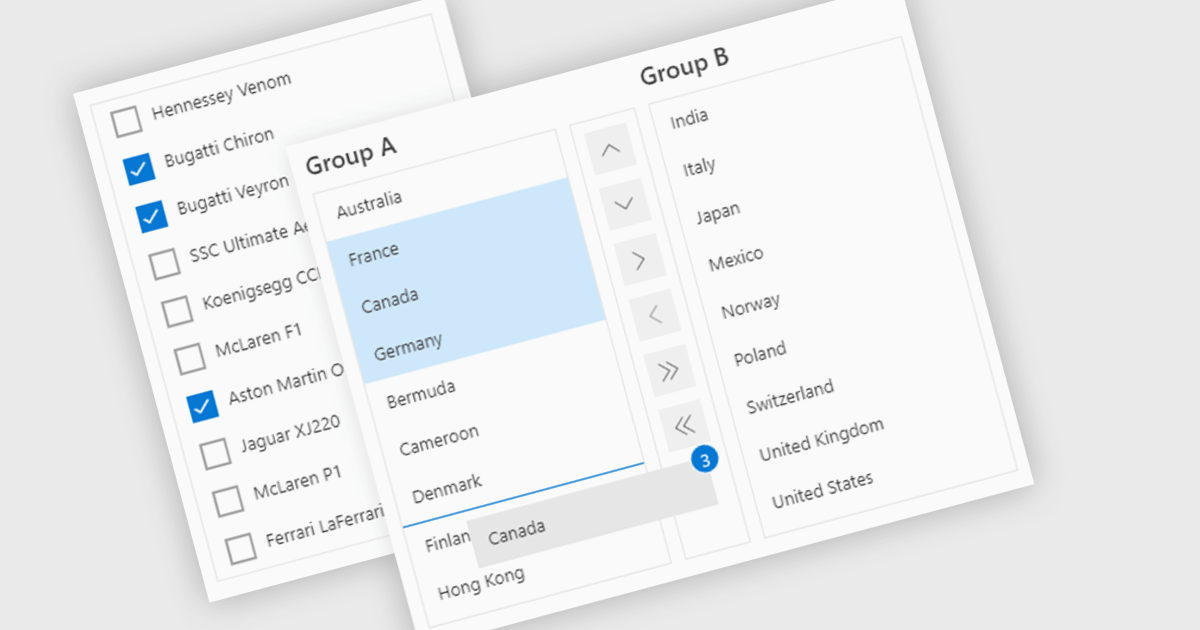
ListBoxes are user interface components in data editors that enable users to select one or more values from a predefined list. They help improve data entry by reducing manual input, ensuring consistent data, and minimizing errors. Commonly used in forms, data grids, and configuration panels, ListBoxes support both static and dynamic data sources, allowing for context-aware filtering and responsive interfaces that adapt to user selections.
Several Angular data editors support listboxes, including:
For an in-depth analysis of features and price, visit our Angular data editors comparison.
聯繫電話: (888) 850 9911
傳真: +1 770 250 6199


