













官方供應商
我們作為官方授權經銷商,直接提供超過200家開發廠家所發行超過1000個的產品授權給您。
請參閱我們所有的品牌。
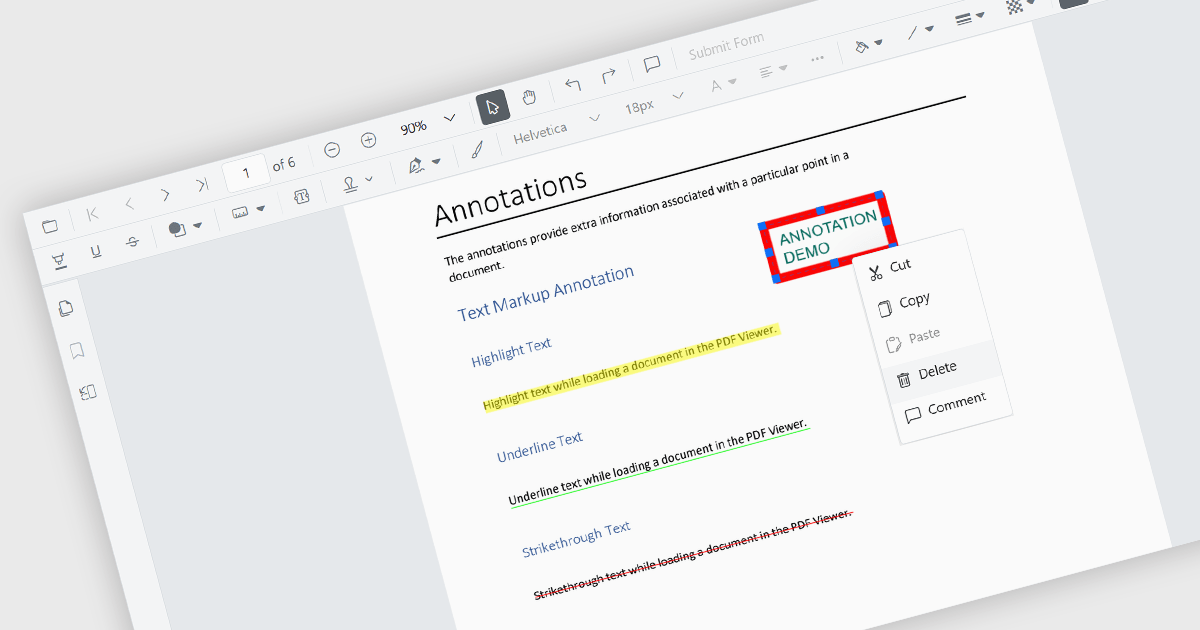
Annotation removal is a useful feature to have in a PDF viewer component, giving users the ability to delete comments, highlights, notes, or other markup that has been added to a PDF document. This functionality allows users to clean up documents by eliminating unnecessary or outdated annotations, ensuring that only relevant and current information remains visible. It is particularly useful in collaborative environments where multiple reviewers contribute feedback, and improves the presentation of the final document, ensuring it is clear and professional. This process yields a clean version of the file in preparation for final distribution or archiving.
Several JavaScript PDF viewer components allow you to remove annotations, including:
For an in-depth analysis of features and price, visit our comparison of JavaScript PDF viewer components.
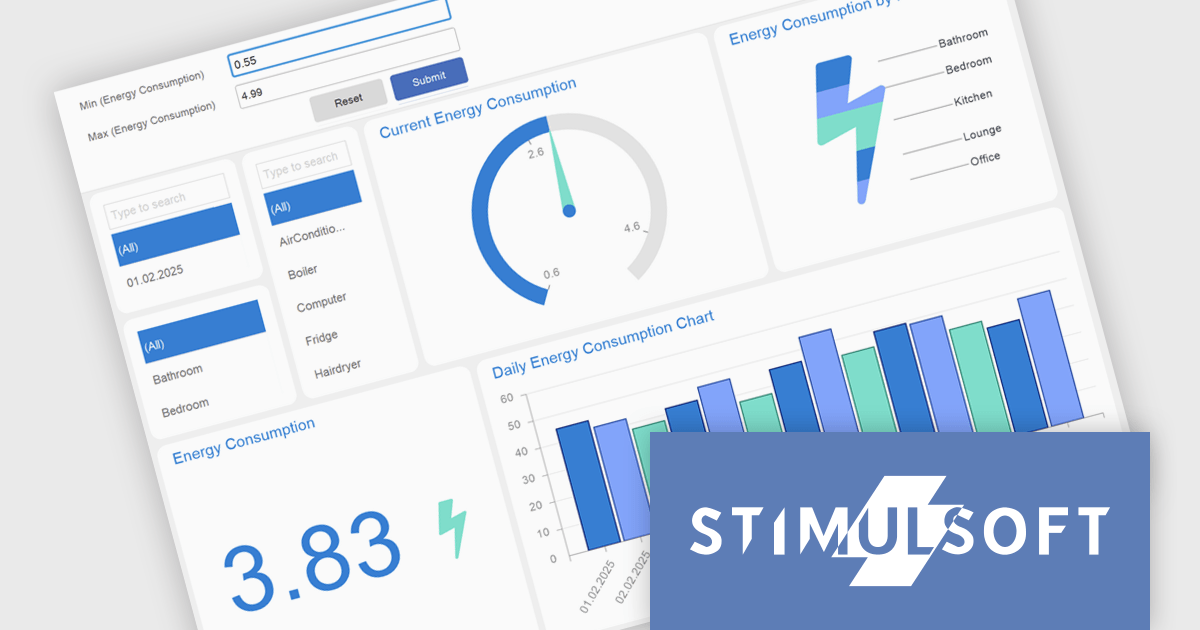
Stimulsoft Dashboards.WEB is a versatile suite of tools for crafting interactive data visualizations for web and desktop applications. It empowers developers to embed intuitive dashboards across various platforms, using the platform-specific components or a centralized cloud designer. With rich data analysis elements, extensive customization options, and pre-built templates, Stimulsoft Dashboards helps you transform complex data into clear, actionable insights for any audience.
The Stimulsoft Dashboards.WEB 2025.2.1 update introduces support for expressions in Gauge range fields, enabling developers to calculate minimum and maximum range bounds dynamically based on underlying data. This enhancement allows for greater flexibility in building responsive dashboards, as Gauge elements can now reflect real-time values without requiring manual adjustments. By integrating expressions directly into the range logic, developers can implement more sophisticated data visualizations that adapt to changing inputs and business logic. This feature streamlines development and supports more efficient maintenance of dynamic reporting scenarios.
To see a full list of what's new in 2025.2.1, see our release notes.
Stimulsoft Dashboards.WEB is licensed per developer and is available as a perpetual license with 1 year support and maintenance. See our Stimulsoft Dashboards.WEB licensing page for full details.
Stimulsoft Dashboards.WEB is available individually or as part of Stimulsoft Ultimate.
Kendo UI by Telerik is a comprehensive suite of JavaScript UI components designed to accelerate web application development. Offering pre-built, customizable elements for grids, charts, schedulers, and more, it streamlines UI creation across popular frameworks like jQuery, Angular, React, and Vue. Key features include responsive design, accessibility, and high performance, enhancing user experience. Developers benefit from reduced development time, consistent UI patterns, and the ability to build feature-rich applications faster.
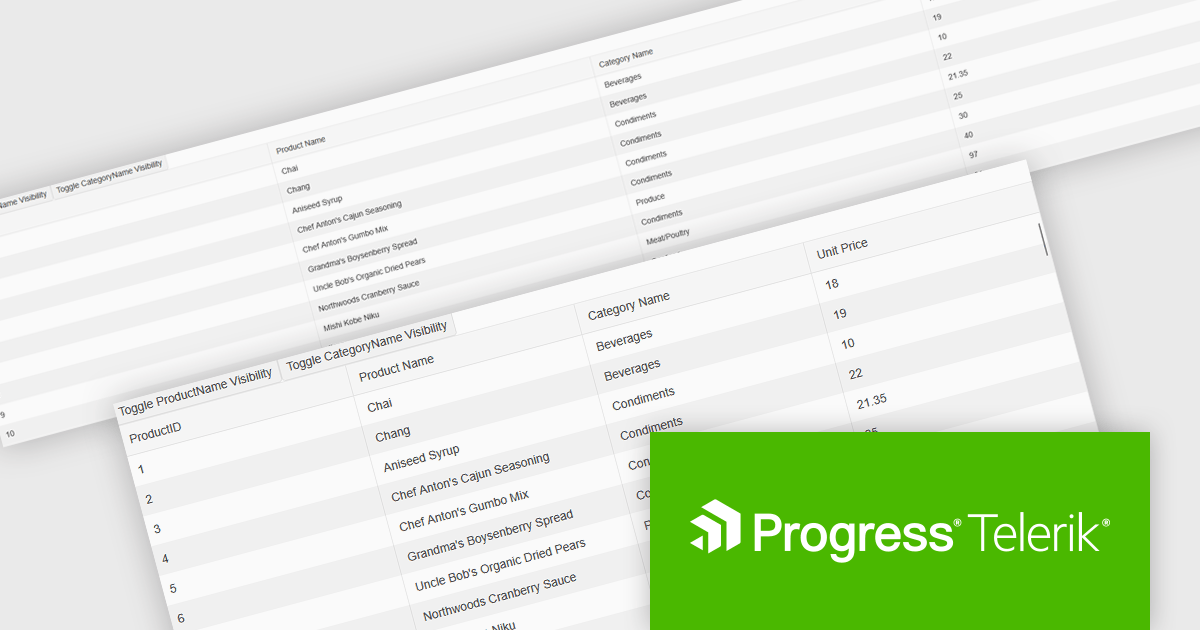
The Kendo UI for Vue 2025 Q1 update enhances grid responsive design, enabling automatic column visibility adjustments based on viewport width. This improvement ensures that data remains accessible and well-structured across different screen sizes without requiring manual configuration. By dynamically toggling columns and adapting height settings to fit their container, the grid provides a seamless and efficient user experience across desktops, tablets, and mobile devices. These enhancements help developers create more adaptive and user-friendly applications with minimal effort, ensuring consistent and optimized data presentation in any environment.
To see a full list of what's new in 2025 Q1 (v6.1.0), see our release notes.
Kendo UI is licensed per developer and has two licensing models: an annual Subscription License and a Perpetual License. The Subscription license provides access to the latest product updates, technical support, and exclusive benefits for a flat annual fee, and must be renewed to continue using the software. The Perpetual license is a one-time purchase granting access to the current released version and includes a one-year subscription for product updates and technical support. After this initial period, users can choose to renew the subscription element to continue receiving updates and support; otherwise, they may continue using the installed version available during their active subscription term but will forgo future updates and support. See our Kendo UI licensing page for full details.
Kendo UI is available individually or as part of the following products:
Wijmo by MESCIUS is a comprehensive JavaScript library offering a suite of high-performance UI components and data grids specifically designed to streamline the development of modern enterprise applications. It emphasizes reduced development time and improved maintainability, along with a focus on performance through its efficient design and small module size. Wijmo integrates seamlessly with popular JavaScript frameworks like Angular, React, and Vue.js, and supports cutting-edge technologies like TypeScript, making it a versatile solution for building complex web applications.
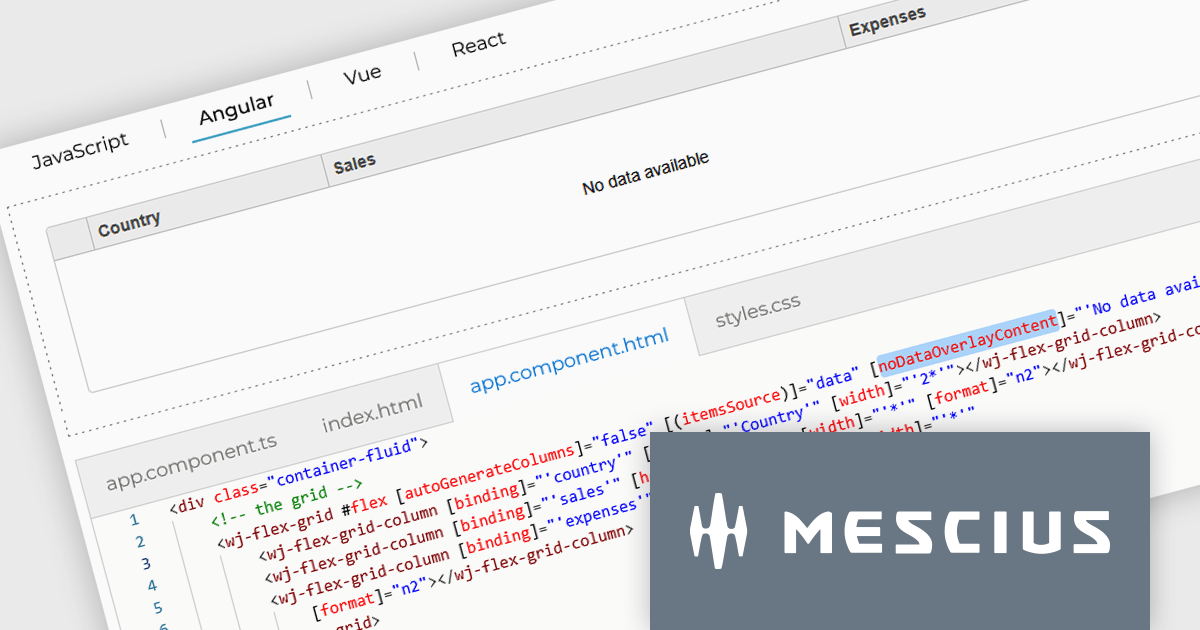
The Wijmo 2025 v1 update introduces a customizable noDataOverlayContent property, enabling developers to display tailored HTML messages when grid data is empty. This improves user experience by replacing blank grid views with informative content, while the new overlayManager allows advanced control over how overlays are rendered and managed. The release also expands framework support, adding compatibility with Angular 19 and Next.js 15 to help developers stay current with modern web development tools.
To see a full list of what's new in 2025 v1 (Build 5.20251.34), see our release notes.
Wijmo is licensed per developer. Developer Licenses are perpetual and include 1 year Subscription which provides upgrades, including bug fixes and new features. See our Wijmo licensing page for full details.
Learn more on our Wijmo product page.
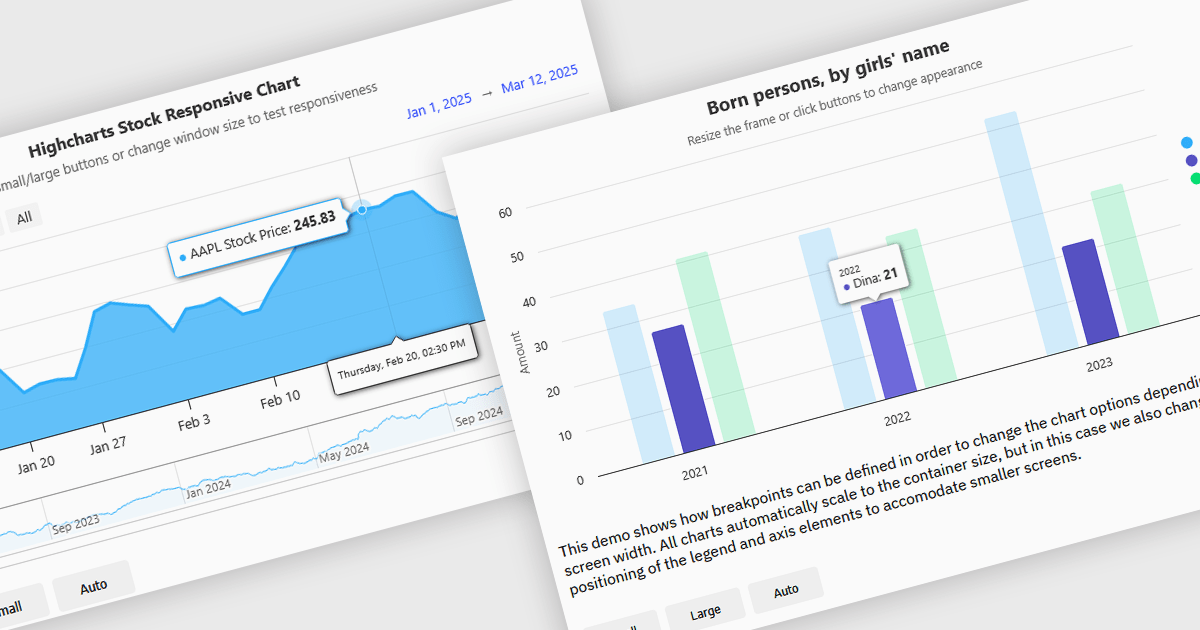
Responsive charts are dynamic data visualizations that automatically adjust to different screen sizes, resolutions, and devices, ensuring a seamless user experience across desktops, tablets, and mobile phones. By adapting elements such as labels, tooltips, legends, and axes, they enhance readability, improve accessibility, and maintain consistent data presentation. These charts optimize performance by efficiently rendering content and supporting interactive features like zooming, panning, and touch gestures. Developers use responsive charts in a wide range of applications, including financial reports, business intelligence dashboards, real-time monitoring systems, and interactive analytics tools, providing users with clear and accessible insights regardless of their device.
Several React charts offer responsive chart support, including:
For an in-depth analysis of features and price, visit our React chart comparison.
聯繫電話: (888) 850 9911
傳真: +1 770 250 6199


