













官方供應商
我們作為官方授權經銷商,直接提供超過200家開發廠家所發行超過1000個的產品授權給您。
請參閱我們所有的品牌。
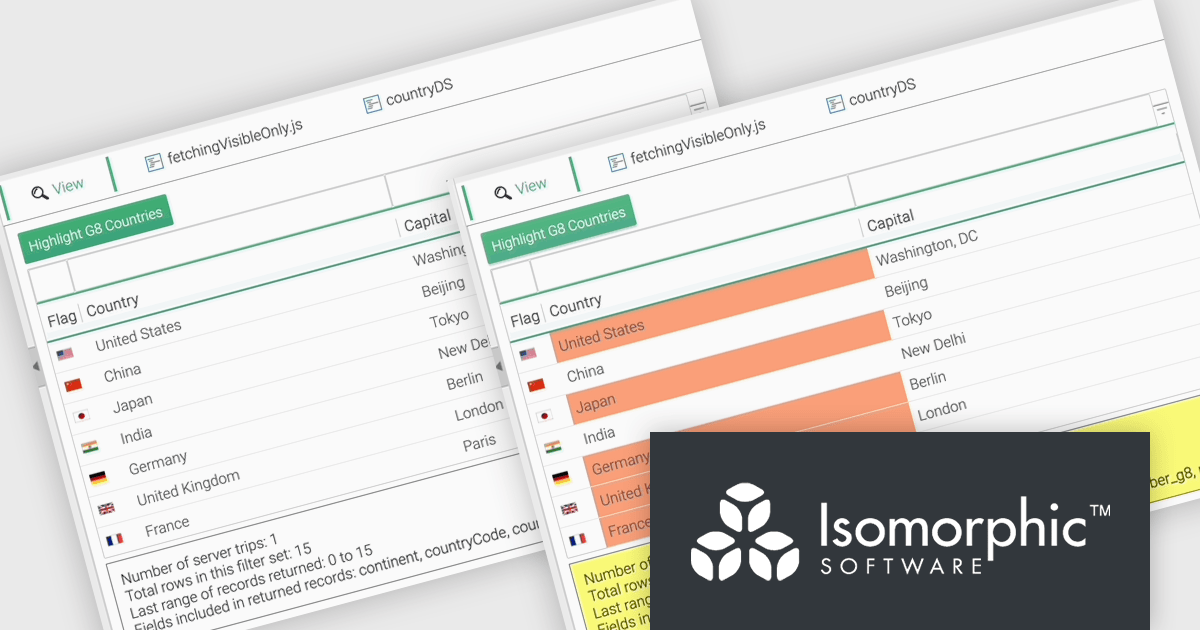
SmartClient is a comprehensive JavaScript component suite compatible with React, Vue, Angular, and more, that empowers you to craft large-scale, high-productivity Enterprise web applications. It provides a comprehensive set of tools for developers, including advanced UI components, robust data management capabilities, and seamless integration with modern backend technologies. Key features include dynamic data fetching, customizable grids, and a responsive interface for a wide range of devices. SmartClient enables developers to create applications with optimized performance, scalability, and a superior user experience. Ideal for enterprise-grade use cases, such as financial analytics, inventory management, and real-time reporting, SmartClient empowers organizations to deliver feature-rich applications that handle complex data requirements with ease.
The SmartClient 13.1 update introduces the Fetch Only Needed Data feature, enabling developers to optimize performance in data-intensive applications by dynamically retrieving only the fields required at a given moment. This targeted data retrieval reduces unnecessary data transfers, minimizes backend load, and enhances responsiveness. Developers can configure grids to fetch additional fields on demand, ensuring efficient resource usage while maintaining flexibility to adapt to dynamic application requirements. By integrating this feature, applications can scale effectively, provide a smoother user experience, and meet the demands of high-performance environments.
To see a full list of what’s new in version 13.1, see our release notes.
SmartClient is licensed per developer and is available as both perpetual and subscription licenses. Product updates and technical support is also available. See our SmartClient licensing page for full details.
For more information, visit our SmartClient product page.

PrizmDoc is a comprehensive REST API platform designed to streamline the integration of secure document viewing, editing, and processing into web applications. Beyond standard features like redaction and annotation, PrizmDoc leverages advanced AI-powered tools to automate and optimize document handling processes, significantly reducing manual effort and boosting productivity. This enables businesses to enhance their document workflows, improve security, and deliver a superior user experience.
On Tuesday, December 3 at 1:00 PM EST Accusoft is presenting a Live Webinar: Exploring Future Trends in AI-Driven Document Management. Discover how PrizmDoc® and IBM watsonx AI are setting new standards for advanced document processing and management, especially within Enterprise Content Management (ECM) applications. Topics will include:
Register today and and discover how AI can streamline workflows and provide secure, effective document management.
PrizmDoc Viewer is available as Self-Hosted, Cloud-Hosted or Private Cloud-Hosted deployments. Billed on an annual subscription basis, you will need to renew your license each year to continue to use the software. The price is based on the number of servers or the number of transactions you require, depending on your deployment method. See our PrizmDoc Viewer licensing page for full details.
For more information, see our PrizmDoc Viewer product page.
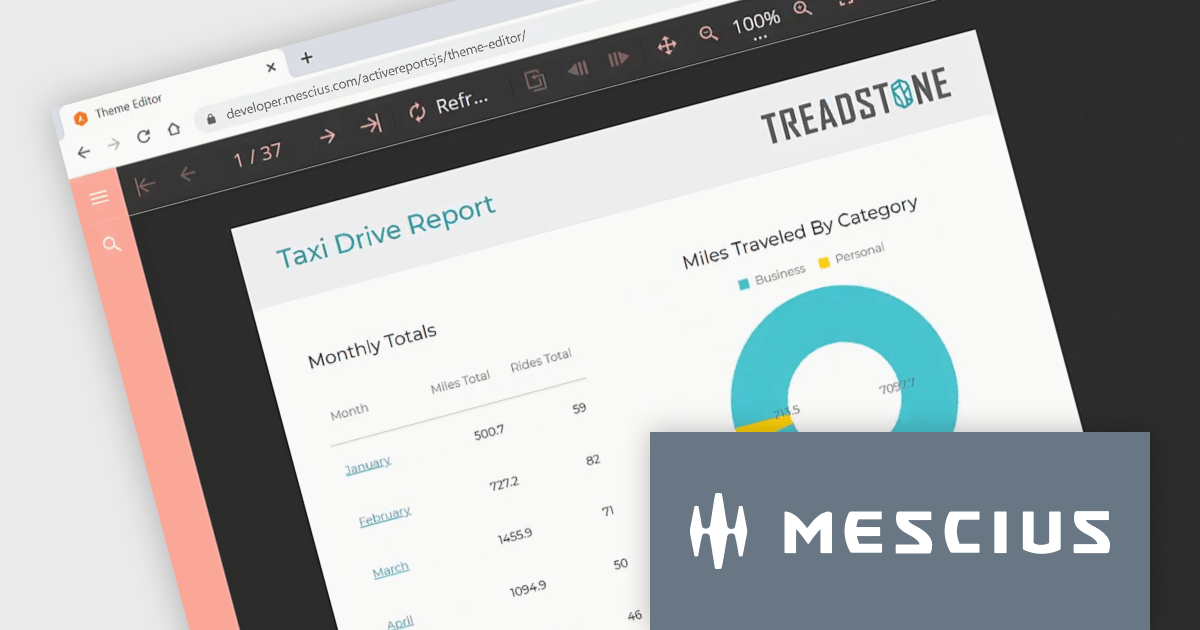
ActiveReportsJS is a robust JavaScript reporting tool that enables developers and report authors to seamlessly design and integrate interactive reports into web applications. It offers advanced features such as drill-down capabilities, runtime data filtering, and interactive parameters, enhancing the functionality and usability of reports. With compatibility across popular frameworks and the flexibility of its report designer component, ActiveReportsJS simplifies the visualization of diverse data sets, making it ideal for applications that require financial reporting, such as balance sheets, and other dynamic reporting needs.
In this blog post, MESCIUS Product Manager Joel Parks shows you how to seamlessly integrate a React Report Viewer into your web application to render, view, and interact with dynamic reports directly within your React project. Steps include:
With the React Report Viewer component, developers can deliver powerful and interactive reporting features that align with the modern requirements of React-based applications, ensuring an optimal user experience.
Read the full blog to learn how to add and customize the Report Viewer component in your React applications.
ActiveReportsJS is licensed on an annual subscription or perpetual basis and is available as a Single Deployment License for non-commercial use, and as a Single Domain License or Unlimited Domain License for commercial and/or SaaS use. See our ActiveReportsJS licensing page for full details.
For more information, visit our ActiveReportsJS product page.
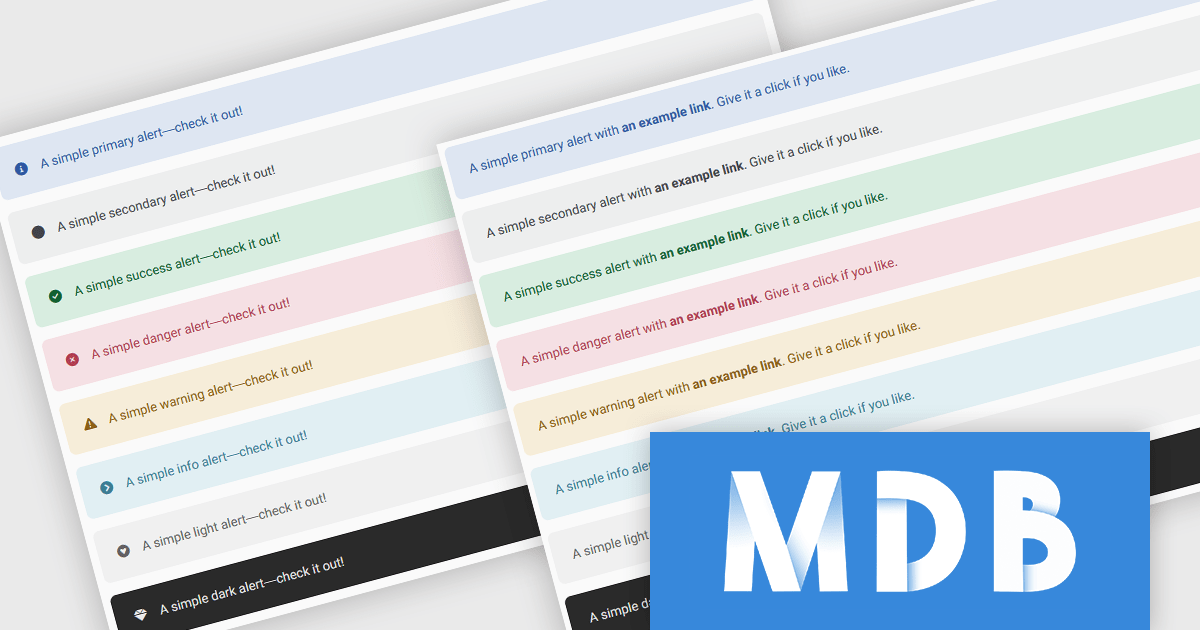
MDB Pro Standard is a powerful front-end development toolkit built on Bootstrap 5, offering responsive and feature-rich components for professional web applications. With tools like customizable alerts, interactive building blocks, and pre-designed templates, it enables developers to deliver visually consistent feedback and create polished, user-friendly interfaces. Supporting icons, rich content, and responsive design, MDB Pro Standard streamlines workflows and is ideal for dashboards, e-commerce sites, and modern web solutions.
MDBootstrap's MDB Pro Standard version 8.1.0 update introduces advanced Bootstrap 5 alerts, providing software developers with a powerful tool for integrating responsive, visually consistent feedback components into their applications. These alerts offer extensive customization options, including contextual classes, support for rich content, and seamless integration with Font Awesome icons, enabling developers to create clear, actionable messages. With the additional ability to incorporate headings, paragraphs, dividers, and interactive, styled links, these alerts can be transformed into detailed, multi-functional components that effectively convey information. By leveraging these pre-designed and flexible elements, users can save time on UI design, ensure compatibility across devices, and deliver polished, engaging feedback systems that enhance the overall user experience.
To see a full list of what's new in version 8.1.0, see our release notes.
MDB Pro Standard is licensed per user, per project/domain with packages for individual developers, teams and Enterprises. See our MDB Pro Standard licensing page for full details.

LightningChart JS is a high-performance JavaScript charting library optimized for real-time data visualization. Leveraging WebGL and GPU acceleration, it enables developers to create interactive, complex charts capable of handling massive datasets with high refresh rates. Ideal for applications demanding rapid data updates and smooth interactions, LightningChart JS provides a robust API for customization and integration into web-based projects.
The LightningChart JS v6.1 update introduces the Parallel Coordinate Chart, a powerful tool designed for advanced data visualization and exploration. It allows developers to work with large-scale datasets, supporting over 100,000 series and multiple axes while maintaining high performance. This chart type is optimized for real-time data input, enabling smooth updates at high stream rates. With features like value-based coloring, range-based highlighting, and interactive cursors, it provides an intuitive way to analyze and interpret complex data relationships, making it an essential addition for creating data-driven applications.
To see a full list of what's new in v6.1, see our release notes.
LightningChart JS is licensed based on method of deployment with options including SaaS Developer Licenses, Application Developer Licenses, and Publisher Developer Licenses. Each license is perpetual and includes 1 year subscription for technical support and software updates. See our LightningChart JS licensing page for full details.
Learn more on our LightningChart JS product page.
聯繫電話: (888) 850 9911
傳真: +1 770 250 6199


