













官方供應商
我們作為官方授權經銷商,直接提供超過200家開發廠家所發行超過1000個的產品授權給您。
請參閱我們所有的品牌。
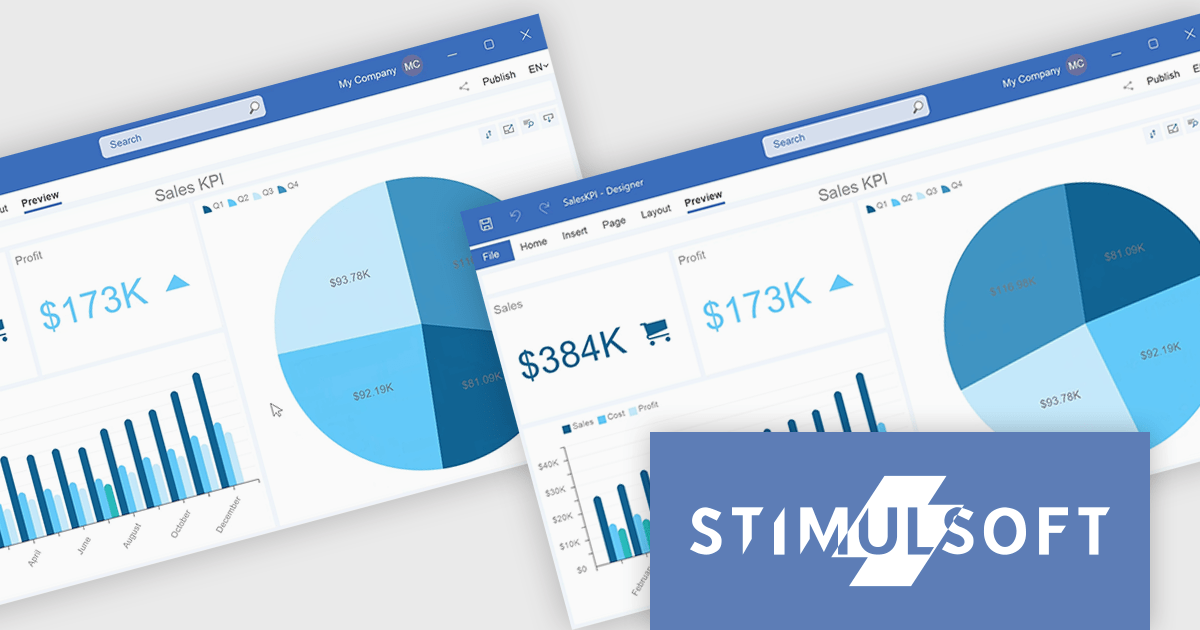
Stimulsoft Dashboards.WIN is a versatile suite of tools for crafting interactive data visualizations for web and desktop applications. It empowers developers to embed intuitive dashboards across various platforms, using platform-specific components or a centralized cloud designer. With data analysis elements, customization options, and pre-built templates, Stimulsoft Dashboards helps you transform complex data into clear, actionable insights for any audience.
The Stimulsoft Dashboards.WIN 2025.1.1 update introduces the ability to rotate pie and doughnut charts directly within the dashboard, providing developers with a powerful new tool for creating more interactive and user-focused applications. This feature allows end-users to manipulate chart orientation using simple mouse actions, enhancing the visualization experience by enabling a closer examination of specific data segments. By integrating this functionality, developers can offer a more intuitive and flexible data analysis environment, aligning with modern UI standards and improving the overall usability of dashboards.
To see a full list of what's new in 2025.1.1, see our release notes.
Stimulsoft Dashboards.WIN is licensed per developer and is available as a perpetual license with 1 year support and maintenance. See our Stimulsoft Dashboards.WIN licensing page for full details.
Stimulsoft Dashboards.WIN is available individually or as part of Stimulsoft Ultimate.
Telerik Reporting is a comprehensive and lightweight embedded reporting tool for .NET web and desktop applications. It enables developers and reporting users to create, design, and export visually appealing, interactive, and reusable reports to effectively present analytical and business data. It supports various technologies, including ASP.NET Core, Blazor, ASP.NET MVC, ASP.NET AJAX, HTML5/JS, Angular, WPF, WinForms, and WinUI.
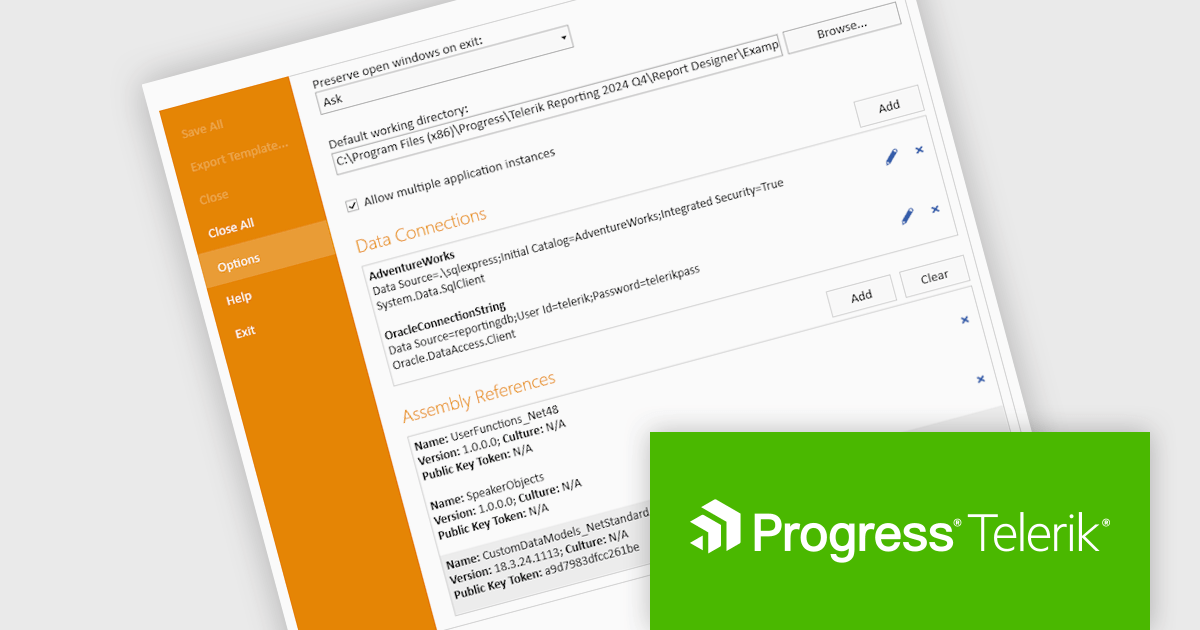
The Telerik Reporting 2024 Q4 update introduces enhanced Standalone Report Designer tooling, providing developers with a streamlined approach to extending the Standard Report Definition (SRD). This new tooling allows for seamless customization through an intuitive UI, eliminating the need to manually edit configuration files or restart the designer after modifications. By enabling real-time updates and reducing workflow interruptions, this feature enhances development efficiency, minimizes errors, and accelerates iteration cycles, ensuring a more productive and user-friendly reporting experience.
To see a full list of what's new in 2024 Q4 (18.3.24.1112), see our release notes.
Telerik Reporting is licensed per developer and is available as a perpetual license with a one year support subscription, which is offered in three tiers: Lite, Priority or Ultimate. See our Telerik Reporting licensing page for full details.
Telerik Reporting is available to buy in the following products:
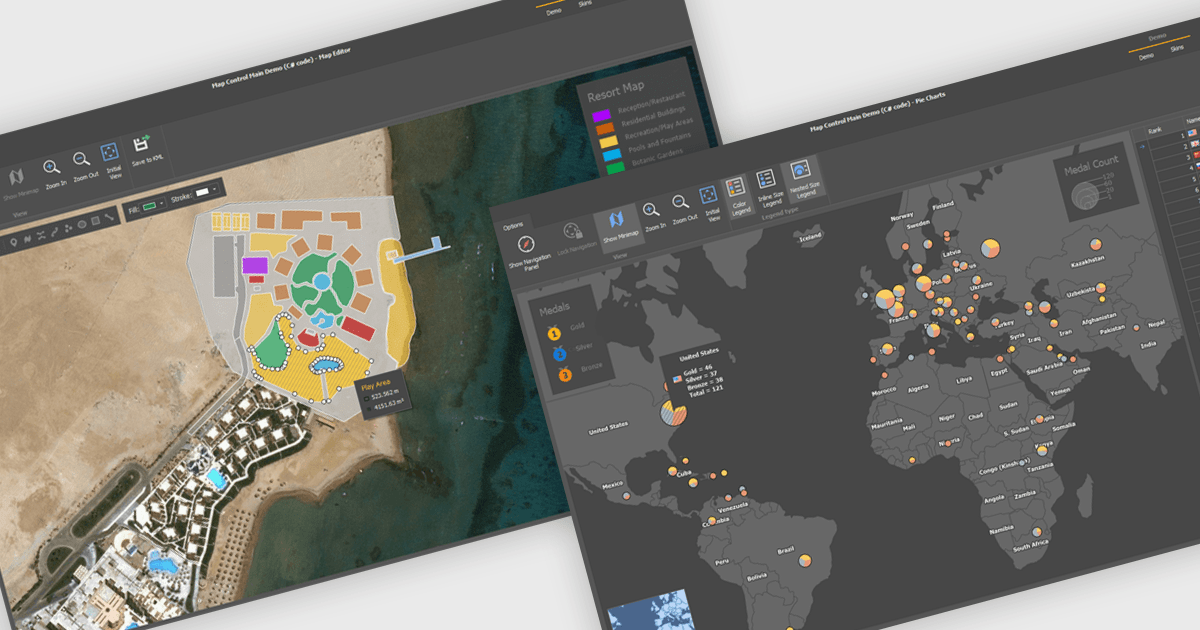
Maps are powerful tools for integrating geographic data and visualizations, enabling users to explore and understand information in a spatial context. With features like zooming, panning, and layering, maps provide an interactive way to analyze data and identify patterns. They support cross-platform compatibility, allowing consistent performance across devices, and can be customized to align with specific branding or design needs.
Several .NET WinForms UI suites offer map components including:
For an in-depth analysis of features and price, visit our comparison of .NET WinForms UI suites.
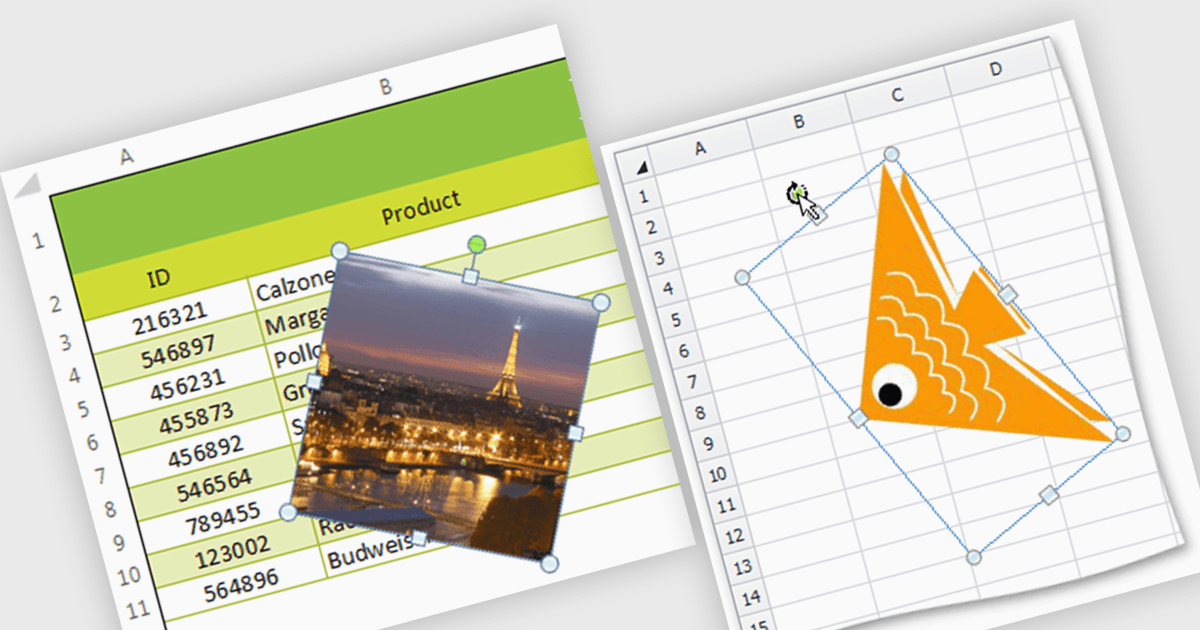
Image support within a spreadsheet component allows developers to seamlessly integrate and manipulate images directly within the spreadsheet environment, enabling features such as inserting, resizing, positioning, and formatting images within cells or as background elements. By embedding images alongside numerical or textual data, users can enhance data visualization, streamline report generation, and provide richer context for decision-making, ultimately improving communication and enabling more effective data analysis within applications.
Several WinForms spreadsheet components support inserting images, including:
For an in-depth analysis of features and price, visit our WinForms spreadsheet controls comparison.
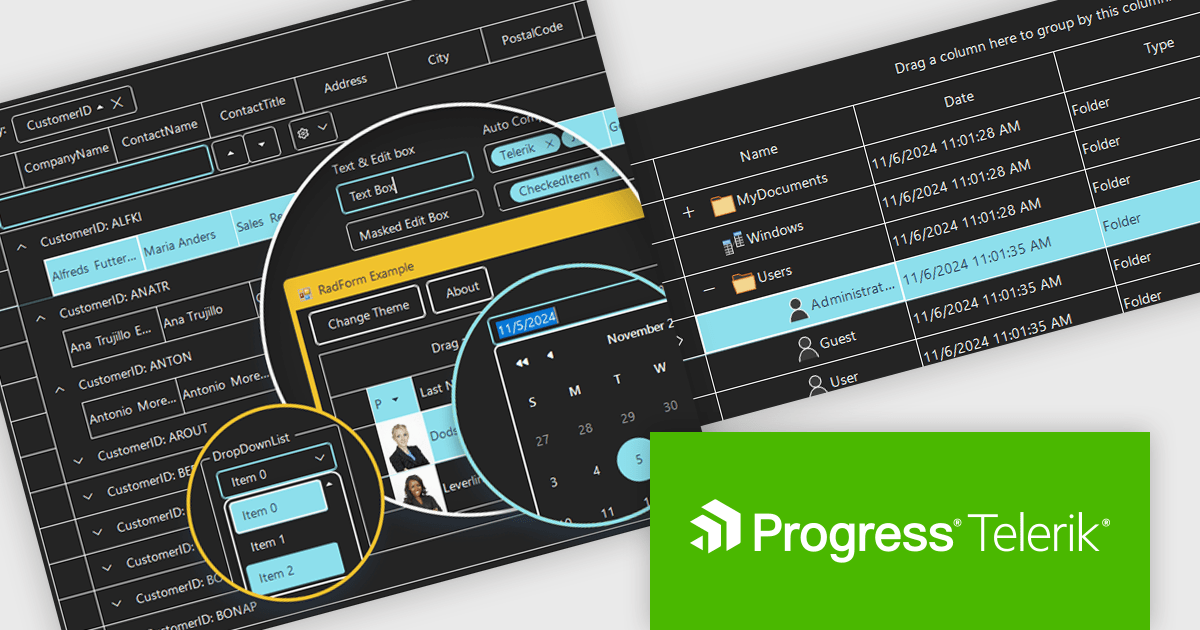
Telerik UI for WinForms is a comprehensive UI library offering over 160 versatile controls designed to streamline the development of modern, data-rich desktop applications. With features like built-in High DPI support, extensive customization options, and components ranging from grids and charts to schedulers and rich text boxes, it empowers developers to craft visually appealing and feature-packed Windows Forms applications.
The Telerik UI for WinForms 2024 Q4 update introduces the Windows 11 High Contrast Theme, providing developers with an essential tool to enhance accessibility and meet the needs of users with visual impairments or those who prefer high-contrast displays. This new theme aligns with Windows 11's modern design principles, ensuring consistency with the operating system's native appearance. By incorporating this theme, developers can create applications that are both visually appealing and inclusive, addressing diverse user requirements while maintaining seamless integration and ease of implementation within existing projects.
To see a full list of what's new in 2024 Q4, see our release notes.
Telerik UI for WinForms is licensed per developer and is available as a perpetual license with a one year support subscription, which is available in three tiers: Lite, Priority or Ultimate. See our Telerik UI for WinForms licensing page for full details.
Telerik UI for WinForms is available individually or as part of the following products:
聯繫電話: (888) 850 9911
傳真: +1 770 250 6199


