


官方供應商
我們作為官方授權經銷商,直接提供超過200家開發廠家所發行超過1000個的產品授權給您。
請參閱我們所有的品牌。

LightningChart .NET is a 2D and 3D data visualization SDK empowering developers with high-performance and flexibility. Boasting over 100 chart types, advanced technical indicators, and real-time rendering capabilities, it handles demanding scientific, financial, and engineering challenges, while its rich API and comprehensive support equip developers to craft informative and interactive dashboards.
The LightningChart .NET v11.0.1.1 release enhances text rendering fidelity in WinForms applications, ensuring exceptional clarity and readability across diverse screen resolutions and DPI configurations. This update guarantees a visually consistent and crisp user experience, independent of the user's device display characteristics. Additionally, it optimizes per-monitor DPI awareness for text rendering in both WinForms and WPF applications, particularly within the .NET 6 build environment. This refinement assures well-rendered and accurately scaled text across multiple monitors with varying DPI settings.
To see a full list of what's new in v11.0.1.1, see our release notes.
LightningChart .NET is available per developer in packages for either WPF, WinForms, UWP or all 3. Each package comes as a subscription license (with 1 or 2 years of limited support), or a perpetual license (with 1 or 2 years of Standard or Premium support). Floating licenses and site licenses are available upon request. See our LightningChart .NET licensing page for full details.
For more information, see our LightningChart .NET product page.
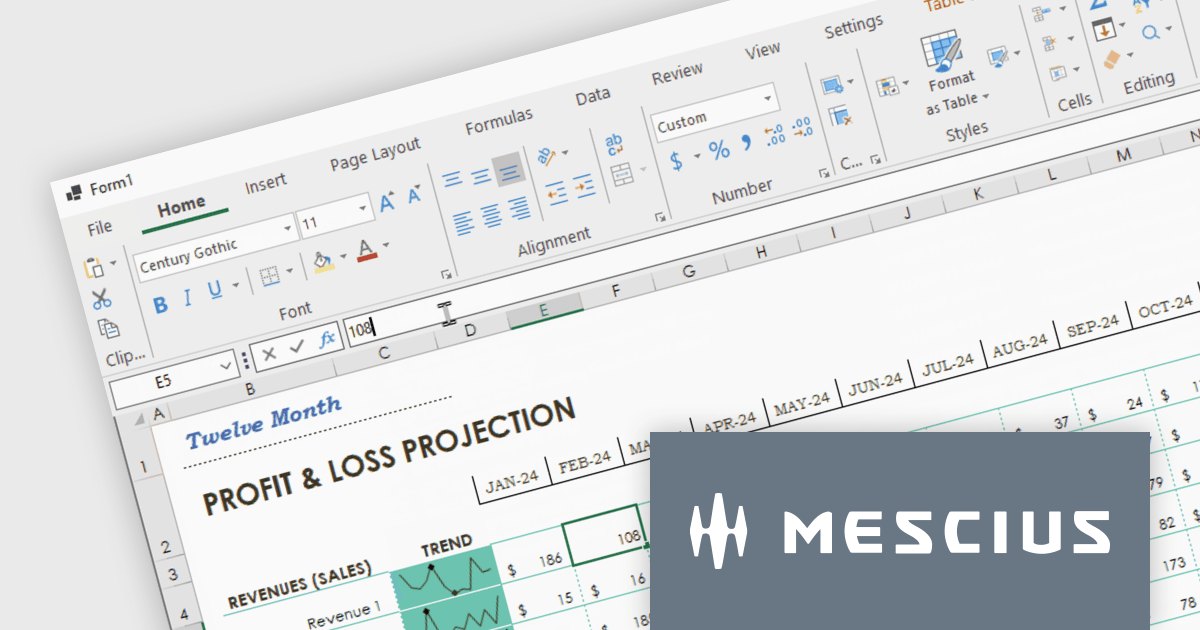
Spread.NET helps you create spreadsheets, grids, dashboards, and forms. It includes a powerful calculation engine with 450+ functions and the ability to import and export Excel spreadsheets. Leverage the extensive .NET spreadsheet API and powerful calculation engine to create analysis, budgeting, dashboard, data collection and management, scientific, and financial applications. You can develop in Visual Studio using VB or C# for WinForms, ASP.NET, and WPF. Spread.NET ensures maximum performance for your enterprise apps and its modular architecture lets you add only the features you need, reducing unnecessary bloat.
In this blog post, MESCIUS Product Marketing Specialist Mackenzie Albitz shows you how to add a spreadsheet ribbon bar control to a .NET 8 WinForms app using C#. Steps include:
Read the complete blog and unlock the powerful capabilities of the Spread.NET component.
Spread.NET is licensed per developer and is available as a Perpetual License with a 12 month support and maintenance subscription. We can supply any Spread.NET license including new licenses, maintenance renewals, and upgrade licenses. See our Spread.NET licensing page for full details.
For more information, visit our Spread.NET product page.
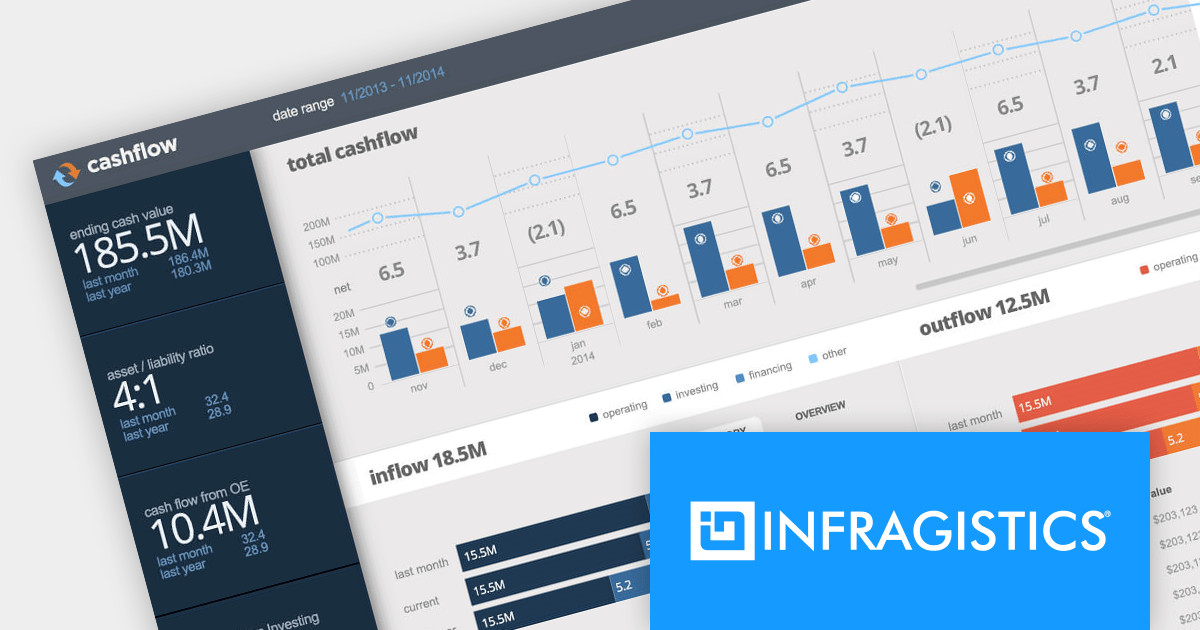
Infragistics Ultimate is a comprehensive toolkit designed to streamline UX/UI creation and development across desktop, web, and mobile platforms. It offers hundreds of pre-built, high-performance UI components like grids and charts, alongside design-to-code tools for rapid prototyping, user testing, and even code generation. This enables developers and designers to create visually appealing and interactive applications faster, while its support for various frameworks and platforms ensures flexibility.
Infragistics Ultimate UI for Windows Forms, Ultimate UI for WPF and Ignite UI for Blazor now support .NET 8. This allows developers to benefit from the performance improvements, cross-platform compatibility, and new APIs in the latest version of Microsoft's leading development framework.
Infragistics Ultimate UI for Windows Forms, Ultimate UI for WPF and Ignite UI for Blazor are licensed per developer and are available as a Perpetual License with 1, 2 or 3 year support and maintenance subscription. See our Infragistics Ultimate UI for Windows Forms, Ultimate UI for WPF and Ignite UI for Blazor licensing pages for full details.
For more information please visit our product pages:
The following product suites also include Infragistics Windows Forms, WPF and Ignite UI:
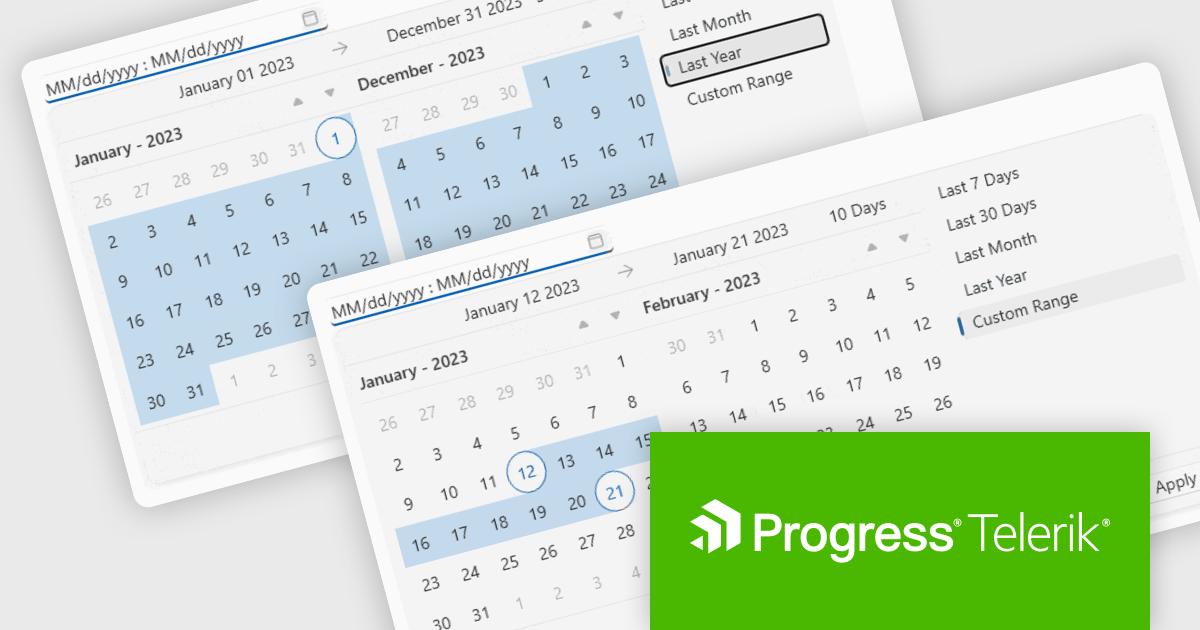
Telerik UI for WPF is an extensive UI library specifically designed for building modern and feature-rich business applications using the Windows Presentation Foundation (WPF) framework. It offers many customizable controls, ranging from data-driven grids and charts to specialized navigation and input components. The suite emphasizes performance and user experience, providing data virtualization for handling large datasets efficiently and ensuring visually appealing interactions.
The Telerik UI for WPF 2024 Q1 update streamlines date selection in your WPF applications with a new DateRangePicker control. This intuitive scheduling component empowers users to effortlessly choose date intervals through interactive calendar popups. It supports pre-defined ranges like "Last Week" or "This Month", as well as custom selections. Developers gain further control with unselectable "blackout date" functionality and extensive customization options, simplifying user interaction and data filtering within their WPF applications.
To see a full list of what's new in 2024 Q1, see our release notes.
Telerik UI for WPF is licensed per developer and is available as a perpetual license with a one year support subscription, which is available in three tiers: Lite, Priority or Ultimate. See our Telerik UI for WPF licensing page for full details.
Telerik UI for WPF is available to buy in the following products:
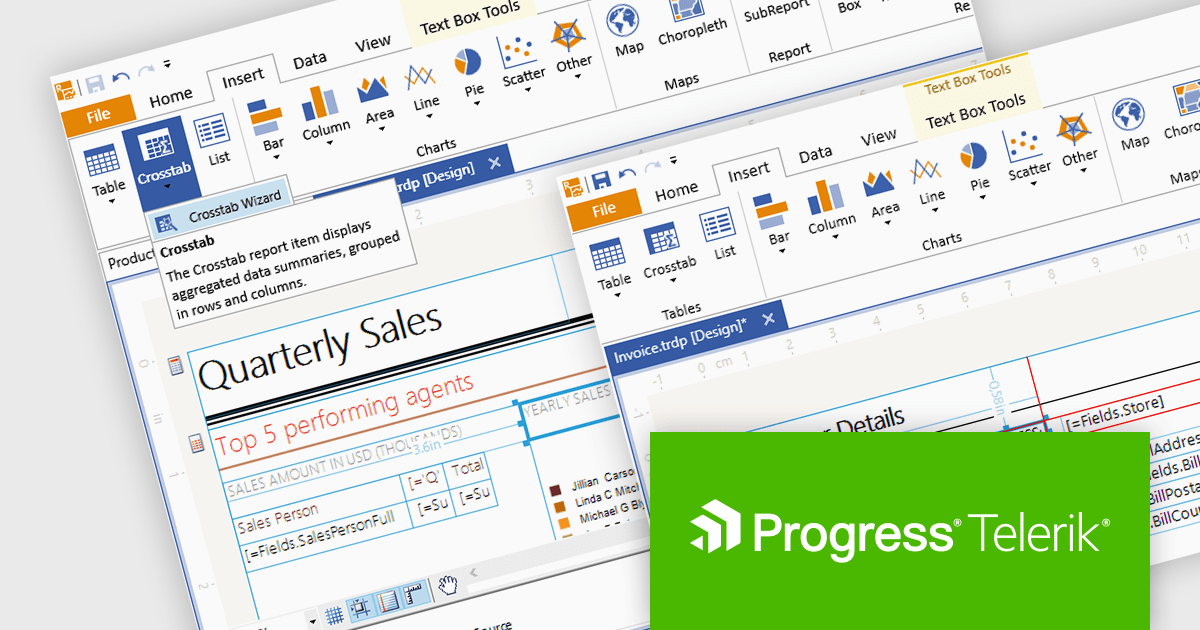
Telerik Reporting is a comprehensive and lightweight embedded reporting tool for .NET web and desktop applications. It enables developers and reporting users to create, design, and export visually appealing, interactive, and reusable reports to effectively present analytical and business data. It supports various technologies, including ASP.NET Core, Blazor, ASP.NET MVC, ASP.NET AJAX, HTML5/JS, Angular, WPF, WinForms, and WinUI.
The Telerik Reporting 2024 Q1 release updates the standalone report designer's target framework from .NET 6 to .NET 8. The designer is a desktop based WYSIWYG reporting tool for Windows, powered by Telerik's reporting engine, that enables users to generate, modify, preview, export and share reports with ease, which can now be achieved using the latest version of Microsoft's popular framework.
To see a full list of what's new in 2024 Q1, see our release notes.
Telerik Reporting is licensed per developer and is available as a perpetual license with a one year support subscription, which is offered in three tiers: Lite, Priority or Ultimate. See our Telerik Reporting licensing page for full details.
Telerik Reporting is available to buy in the following products:
聯繫電話: (888) 850 9911
傳真: +1 770 250 6199


