


官方供應商
我們作為官方授權經銷商,直接提供超過200家開發廠家所發行超過1000個的產品授權給您。
請參閱我們所有的品牌。
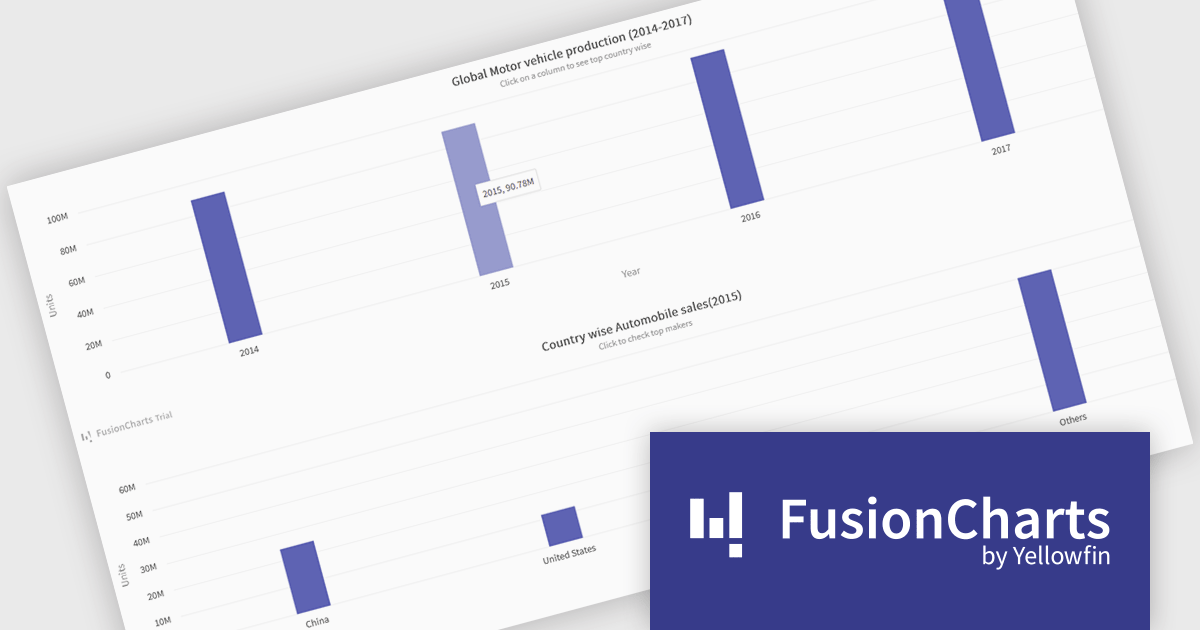
FusionCharts Suite XT is a collection of charting and mapping tools that helps developers create interactive and data-driven dashboards for their web and mobile applications. It provides a wide range of features, including over 100 chart types, data-driven maps, and a variety of customization options. FusionCharts Suite XT helps you visualize and present data in a clear and engaging way.
FusionCharts Suite XT allows developers to implement drill down charts that let users click individual data points to view related charts with more detailed information. This functionality helps developers present large or complex datasets in a structured way, allowing applications to display high level summaries while providing access to deeper data when required. By supporting multiple levels of drill down across most chart types, it supports scalable and interactive data exploration without overloading the initial visualization.
FusionCharts Suite XT is licensed through tiered plans, including Basic, Pro, Enterprise, and Enterprise+, available as annual or perpetual licenses for different developer and deployment needs. See our FusionCharts Suite XT licensing page for full details.
For more information, visit our FusionCharts Suite product page.
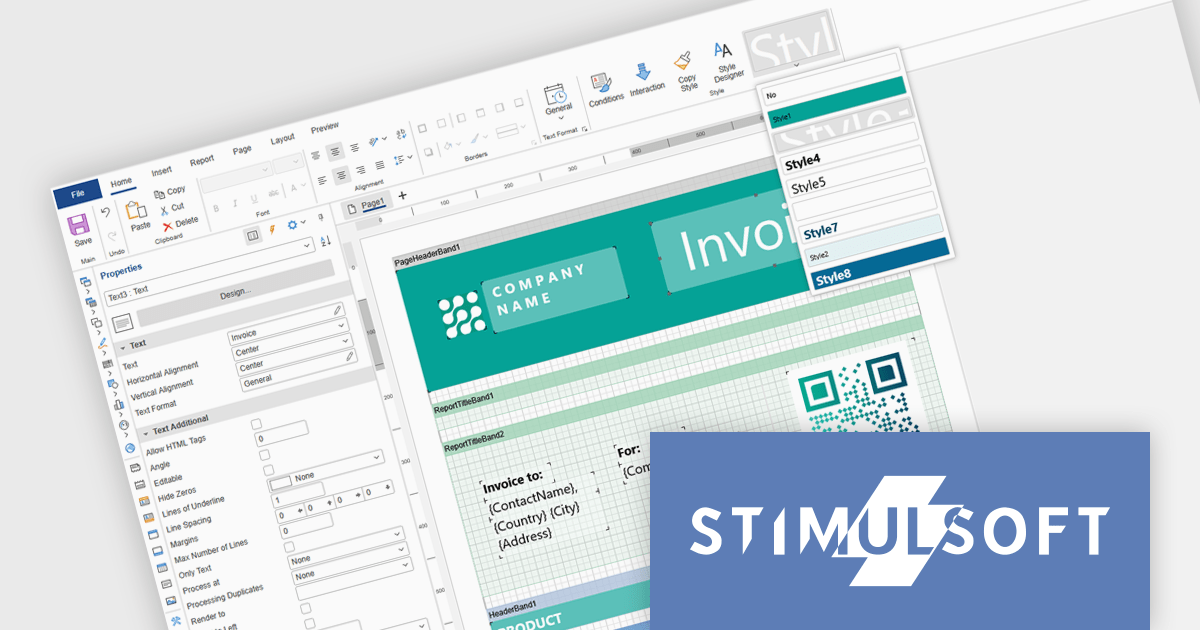
Stimulsoft Ultimate is a reporting and dashboard solution that provides a set of tools for building interactive reports and data visualizations across platforms, including WinForms, ASP.NET, .NET Core, Blazor, JavaScript, WPF, PHP, Java, and Avalonia. It enables developers and organizations to design, generate, and deploy professional reports and dashboards using visual designers, flexible styling options, rich charting and data visualization components, and extensive data connectivity. With support for multiple development environments and technologies, Stimulsoft Ultimate helps teams improve report creation, maintain consistent designs, and deliver clear, data-driven insights for business intelligence, analytics, operational reporting, and enterprise applications.
Stimulsoft Ultimate enables developers to apply centralized report styling that ensures consistent formatting across report elements while reducing the time required to design and maintain reports. By using reusable styles for fonts, colors, borders, and other visual properties, developers can standardize report layouts, quickly apply formatting to multiple components, and implement global design changes without editing each element individually. This approach improves development efficiency, simplifies maintenance, and helps teams deliver professional, visually consistent reports across applications and platforms.
Stimulsoft Ultimate is licensed per developer with Single, Team, Enterprise, and WorldWide options that support one to unlimited developers within an organization. Licenses include a 12 month subscription with updates, priority technical support, a royalty free runtime report designer and viewer, and a build server license for Team and higher tiers. See our Stimulsoft Ultimate licensing page for full details.
For more information, visit our Stimulsoft Ultimate product page.
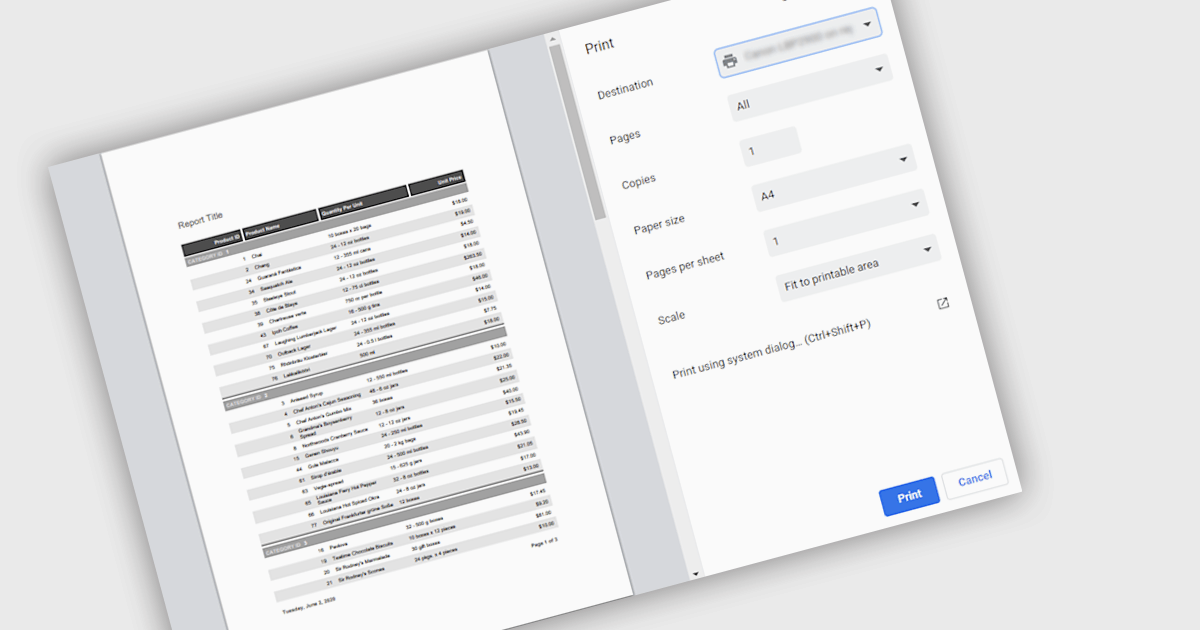
Printing reports allows users to generate physical copies of structured data, summaries, or analysis directly from an application. By converting digital information into printed documents, users can easily review content offline, share insights in meetings, and maintain clear records for documentation or compliance. Printed reports provide a consistent layout that improves readability and makes complex information easier to present to stakeholders who may prefer or require hard copies. Common use cases include distributing reports during team meetings, preparing documentation for audits or regulatory requirements, archiving important records, and sharing key findings with clients or decision-makers in a clear and professional format.
Several .NET reporting components support printing including:
For an in-depth analysis of features and price, visit our .NET reporting comparison.
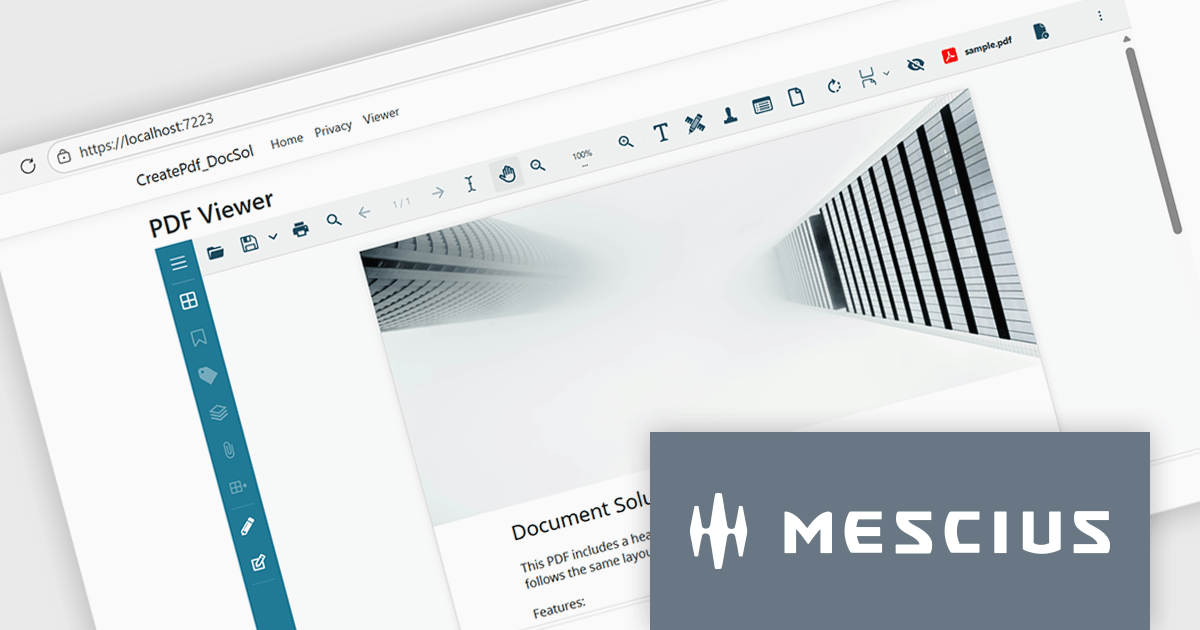
Document Solutions for PDF (DsPdf, formerly GcPdf) is a high-speed, feature-rich, server-side PDF API Library for .NET with no dependencies on Adobe Acrobat. DsPdf allows developers to programmatically create, manipulate, import/export, and deploy PDF documents, including AcroForms, across desktop and web applications at scale. With full .NET support, you can generate, load, modify, and convert PDFs in your app for .NET, Mono, Xamarin.iOS, and Xamarin.Android.
In this blog post, MESCIUS Product Specialist Kristina Ismail demonstrates how to integrate the DsPdf API library on the server side, along with the included JavaScript PDF Viewer to load, generate, and display PDF files in the browser inside an ASP.NET Core application. Steps include:
Read the complete blog to learn how to implement an end-to-end PDF workflow inside any ASP.NET Core application.
Document Solutions for PDF is licensed per developer and is available in several license options for differing distribution needs. Team licenses are also available for multiple developers within the same organization. See our Document Solutions for PDF licensing page for full details.
Document Solutions for PDF is available to buy individually or as part of Document Solutions .NET Bundle.
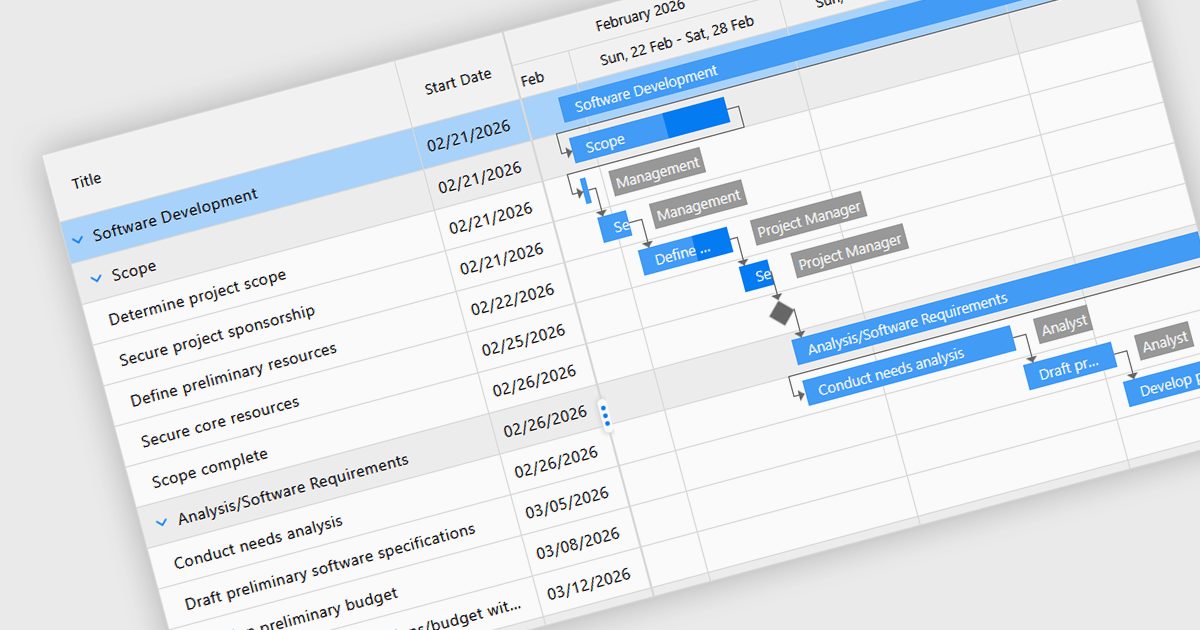
Gantt controls in ASP.NET Core UI suites are specialized components used to visualize and manage project schedules within web applications. They present tasks along a timeline in a Gantt chart format, showing start and end dates, task dependencies, progress, and resource allocation in a clear graphical view. Developers can integrate these controls to provide features such as task hierarchy, drag-and-drop scheduling, dependency linking, milestone tracking, and interactive editing directly in the browser. Many implementations also support data binding to backend services, filtering, and export capabilities, making them suitable for project management systems, planning tools, and enterprise dashboards where users need to monitor timelines and coordinate complex workflows efficiently.
Several ASP.NET Core UI Suites contain Gantt controls including:
For an in-depth analysis of features and price, visit our comparison of ASP.NET Core UI Suites.
聯繫電話: (888) 850 9911
傳真: +1 770 250 6199


