


官方供應商
我們作為官方授權經銷商,直接提供超過200家開發廠家所發行超過1000個的產品授權給您。
請參閱我們所有的品牌。
Text Control DS Server is an on-premise document services back-end for document processing. It includes a Microsoft Word compatible document editor, a lightweight document viewer, and a powerful document processing API.
Version 3.2.0 adds support for a new SVG rendering mode within the online document editor, improving performance in scenarios such as limited bandwidth or elevated ping times. By default the editor automatically determines the most suitable rendering method based on factors such as bandwidth availability.
To see a full list of what's new in version 3.2.0, see our release notes.
For more information, visit our Text Control DS Server product page.
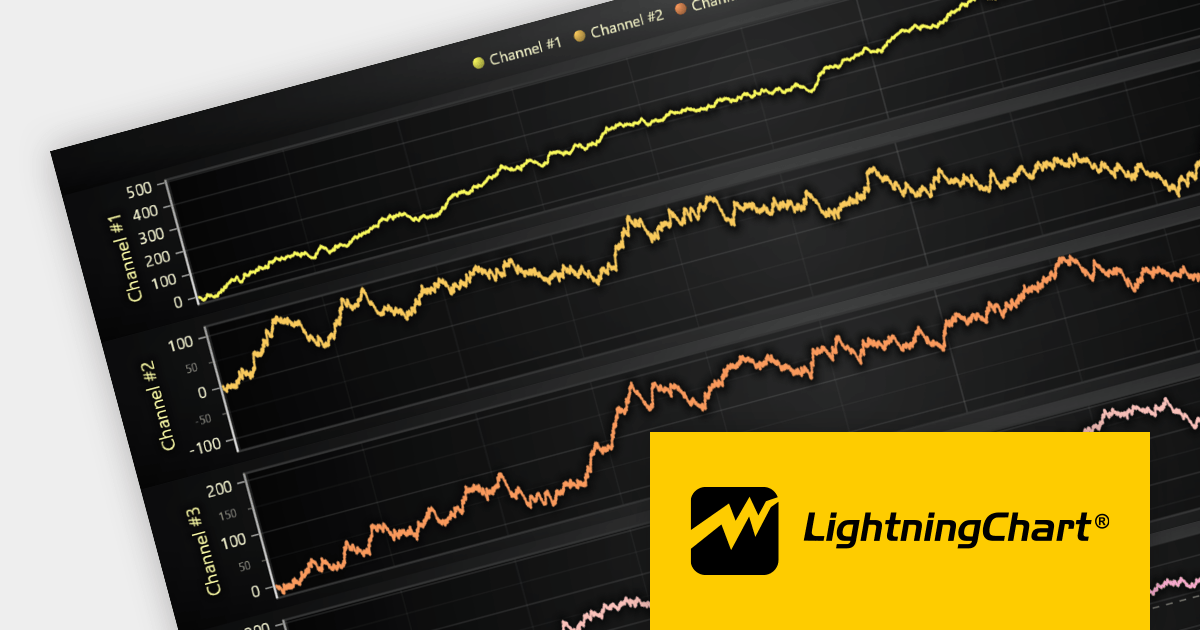
LightningChart JS is a high-performance JavaScript charting library that utilizes WebGL rendering and GPU acceleration to deliver exceptional performance for a wide range of data visualization needs. It is designed to handle large datasets and complex visualizations with ease, enabling developers to create interactive and visually appealing charts for various applications.
The LightningChart JS v5.0 release introduces WebGL context sharing, enabling the sharing of WebGL resources (e.g. textures, shaders, and buffers) across multiple WebGL contexts. This enhances the performance of multi-chart displays, minimizes memory consumption, and simplifies resource management. It optimizes the rendering of each chart, regardless of their arrangement or quantity. Developers can now employ HTML <div> elements to define chart layouts and use CSS for precise control over positioning.
To see a full list of what's new in v5.0.0, see our release notes.
For more information, see our LightningChart JS product page.
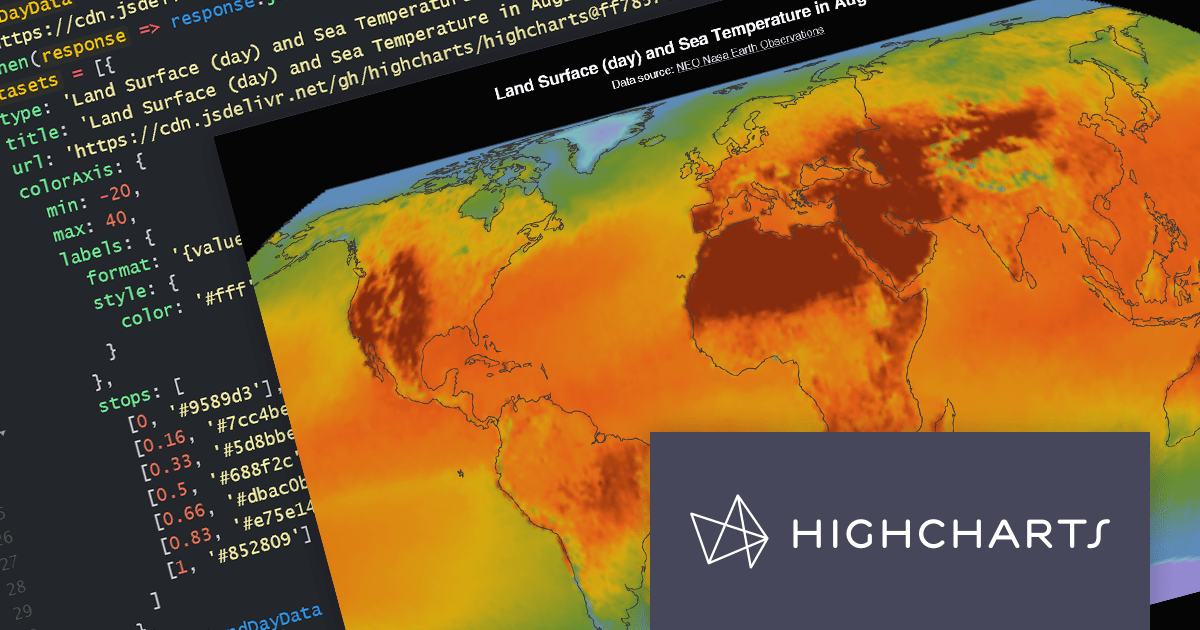
Highcharts Maps provides a standards-compliant method for creating schematic maps in web-based projects. It extends the user-friendly Highcharts JavaScript API to allow web developers to create interactive maps that display sales, election results, or any other geographically related information.
The Highchartts Maps v11.2.0 release adds support for interpolation in geographic heatmaps. The geoheatmap.interpolation feature allows the heatmap to render its data points as an interpolated image, estimating values between known data points. For example, you may have a have a table of temperature data that shows the temperature at specific points within a region. You can use interpolation to estimate the temperature in areas between the known data points. This new feature helps to create more easily understandable and visually appealing heatmaps, even with limited data sets.
To see a full list of what's new in version 11.2.0, see our release notes.
For more information, visit our Highcharts Maps product page.

Highcharts is an industry-leading JavaScript charting library, used by tens of thousands of developers and over 80% of the world's 100 largest companies. Highcharts Core (formerly Highcharts JS) is an SVG-based, multi-platform charting library that has been actively developed since 2009.
Highcharts v11.2.0 adds new options for the presentation of Sankey chart types. The nodeAlignment option lets you specify which side of the chart nodes should align to, facilitating a vertical layout. The linkColorMode option determines the color mode for Sankey links, including matching the "from" node, the "to" node, or a gradient between the two.
Sankey charts are a type of flow diagram suited to visualizing complex data that changes over time. With the added Sankey chart display options, Highcharts now offers more impactful ways to visualize your data.
To see a full list of what’s new in v11.2.0, see our release notes.
For more information, visit our Highcharts Core product page.

MindFusion.Diagramming for JavaScript allows you create flow diagrams using predefined node shapes. You can use links to join nodes together and users can create, resize, select, move and modify nodes and links as needed. All diagram elements can be accessed programmatically and methods are available to changing the appearance of all elements.
The version 4.4 release has been extended to include support for animations. Diagram items support the animation of fill color, stroke color and opacity. Diagram nodes can now include bounce, shake, pulse and path animations. The diagram view itself now offers animated zooming and scrolling.
To see a full list of what's new in version 4.4, see our release notes.
For more information, visit our MindFusion.Diagramming for JavaScript product page.
聯繫電話: (888) 850 9911
傳真: +1 770 250 6199


