













官方供應商
我們作為官方授權經銷商,直接提供超過200家開發廠家所發行超過1000個的產品授權給您。
請參閱我們所有的品牌。
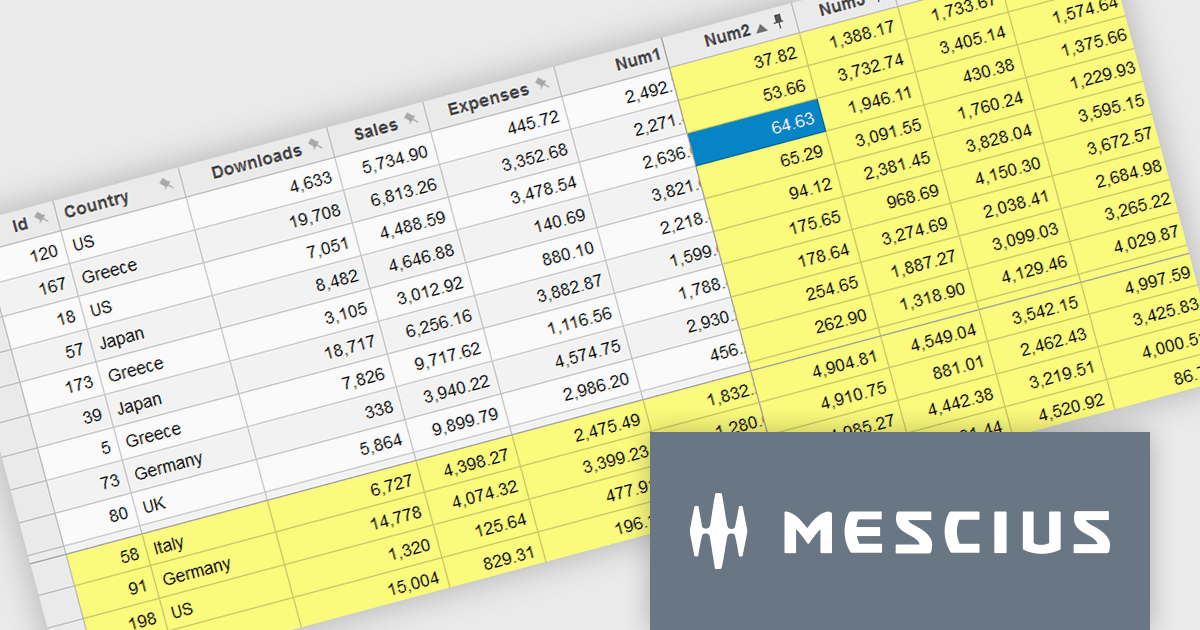
Wijmo by MESCIUS is a comprehensive JavaScript library offering a suite of high-performance UI components and data grids specifically designed to streamline the development of modern enterprise applications. It emphasizes reduced development time and improved maintainability, along with a focus on performance through its efficient design and small module size. Wijmo integrates seamlessly with popular JavaScript frameworks like Angular, React, and Vue.js, and supports cutting-edge technologies like TypeScript, making it a versatile solution for building complex web applications.
The Wijmo 2024 v2 update improves FlexGrid with the ability to freeze and pin columns to the right and rows to the bottom. Previously, freezing was limited to the left side for columns and the top for rows. Experience greater flexibility and improved data presentation with the ability to freeze cells in any direction. This feature streamlines data analysis by keeping critical rows and columns visible, enhancing usability and allowing users to focus on key information. With a more intuitive interface, users enjoy a seamless experience, leading to higher satisfaction and a more professional software tool.
To see a full list of what's new in 2024 v2 (Build 5.20242.21), see our release notes.
Wijmo is licensed per developer. Developer Licenses are perpetual and include 1 year Subscription which provides upgrades, including bug fixes and new features. See our Wijmo licensing page for full details.
Learn more on our Wijmo product page.
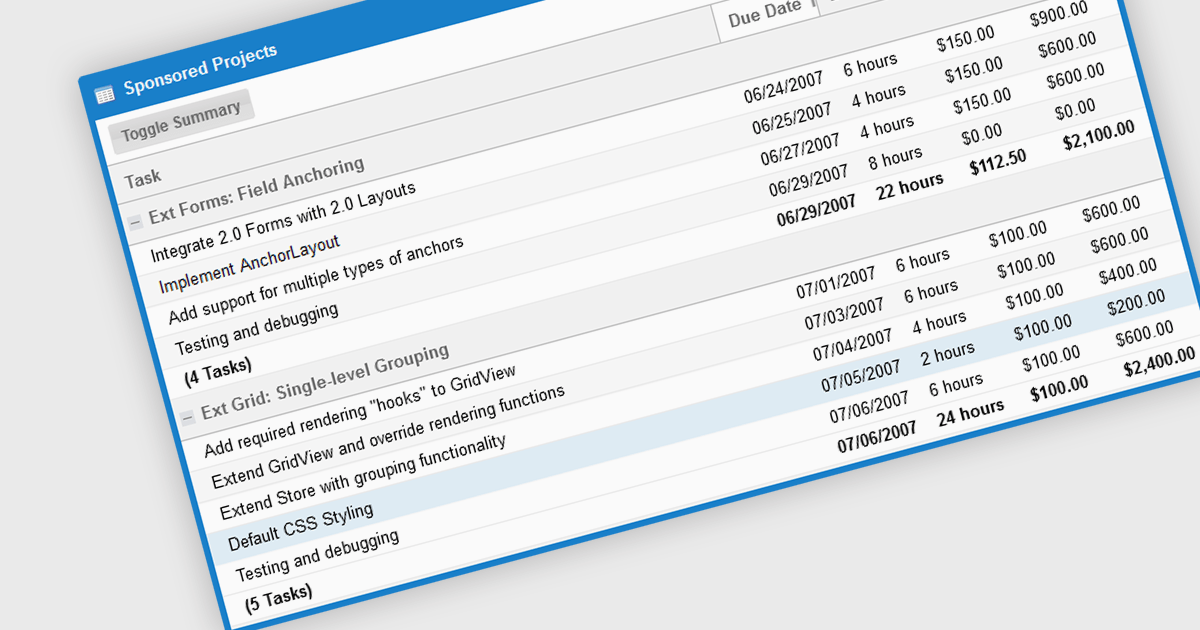
The grouping/summary feature in grid controls enables users to categorize and analyze data effectively by grouping rows based on specific criteria. This functionality allows for the aggregation of data within each group, providing valuable summaries such as totals, averages, counts, and more. By organizing information in a more structured manner, users can gain deeper insights into trends, patterns, and outliers within their data. This feature is particularly useful for large datasets, financial reporting, and data analysis tasks that require a high level of customization and flexibility.
Several JavaScript Grid controls offer grouping / summary support including:
For an in-depth analysis of features and price, visit our comparison of JavaScript grid controls.
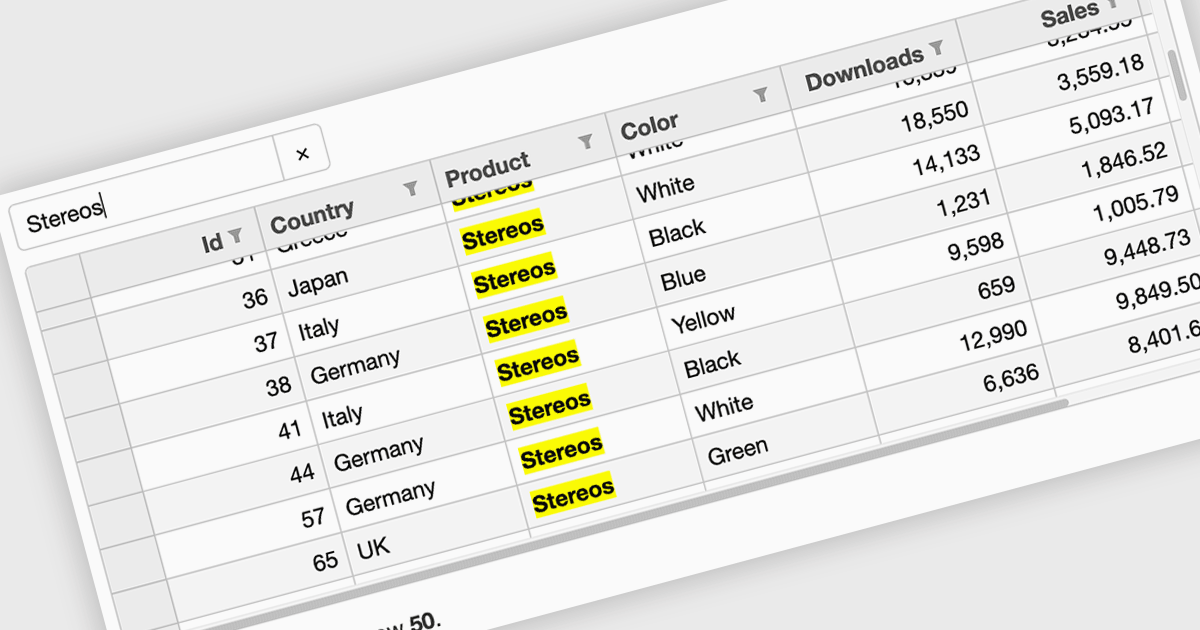
Searching in a grid component refers to the ability for users to quickly locate specific data within a table or grid-like structure. It involves filtering the displayed data based on user-defined criteria, such as text strings or numerical values. This functionality significantly enhances user experience by allowing users to efficiently find relevant information without having to manually scan through large datasets. By implementing search functionality, developers can improve the usability and overall effectiveness of their grid applications.
Several Vue.js grid controls offer searching functionality including:
For an in-depth analysis of features and price, visit our comparison of Vue.js grid controls.
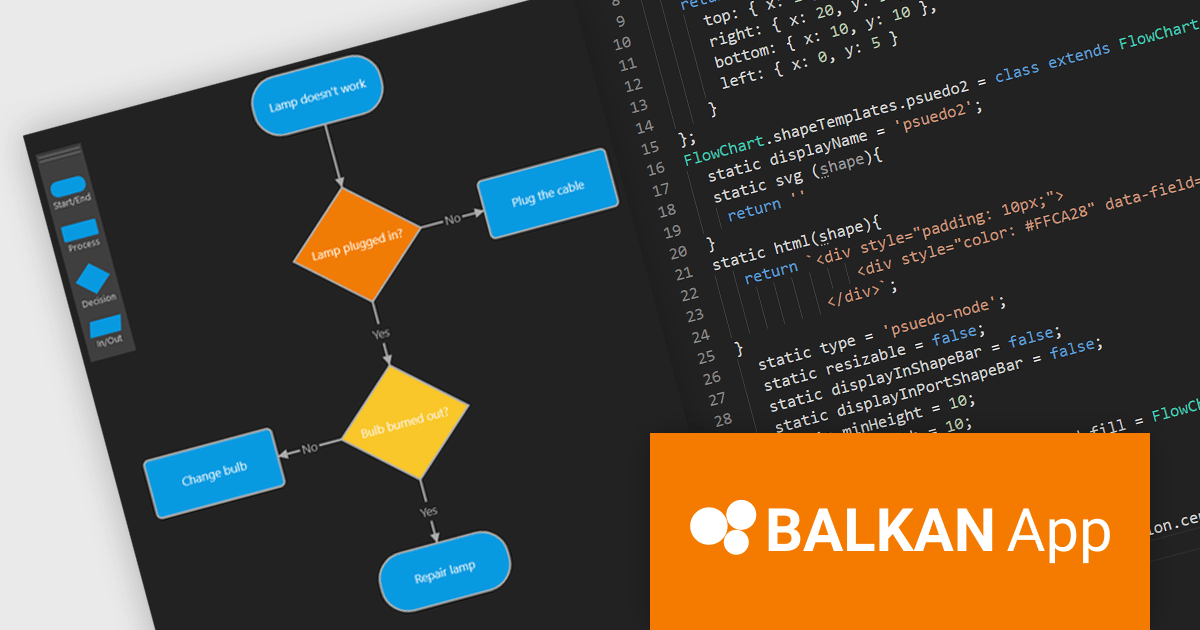
FlowChart JS, a powerful new JavaScript library from BALKAN App, the creators of OrgChart JS, is designed to streamline the creation of interactive and customizable flowcharts. It seamlessly integrates with React, Angular, and Vue.js, offering an intuitive drag-and-drop interface and real-time visual editing, making it easy to visualize complex processes and systems. The library provides a rich set of pre-built shapes and nodes, with the flexibility to create custom shapes, advanced connection and routing options, and a robust API. Its seamless integration into existing applications simplifies the development of clear, structured visualizations.
This new product streamlines the flowchart creation process and enhances visual communication, enabling users to quickly assemble intricate diagrams without extensive coding knowledge. The library's flexibility makes it suitable for a wide range of use cases including business process modeling, software development, educational materials, and technical documentation. By transforming complex information into visually appealing and understandable diagrams, FlowChart JS improves collaboration, decision-making, and problem-solving, providing JavaScript applications with powerful data visualization capabilities.
FlowChart JS is licensed on a perpetual basis with 1 year support and maintenance. Single website, unlimited websites or SaaS, and OEM licenses are available. See our FlowChart JS licensing page for full details.
For more information, see our FlowChart JS product page.

Calculated fields are dynamic values derived from existing data within reporting components. They enable complex data manipulations, calculations, and transformations, providing enhanced data analysis capabilities. By creating new fields based on existing data, calculated fields offer flexibility and efficiency, allowing users to perform calculations, aggregations, and logical comparisons directly within the report. This empowers users to generate insights, visualize trends, and make data-driven decisions without requiring modifications to the underlying data source, ultimately improving report accuracy and usability.
Several Vue.js reporting components offer support for calculated fields:
For an in-depth analysis of features and price, visit Vue.js reporting components comparison.
聯繫電話: (888) 850 9911
傳真: +1 770 250 6199


