


官方供應商
我們作為官方授權經銷商,直接提供超過200家開發廠家所發行超過1000個的產品授權給您。
請參閱我們所有的品牌。
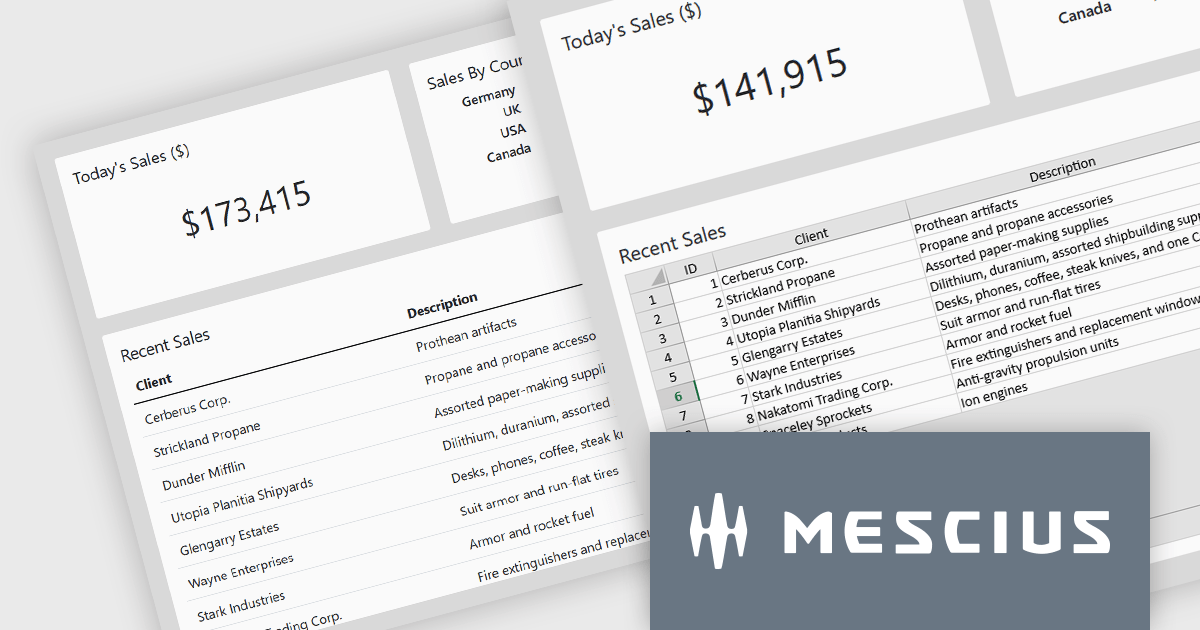
SpreadJS by MESCIUS is a high-performance JavaScript spreadsheet component designed to seamlessly integrate Excel-like functionality into web applications. It empowers developers to deliver robust spreadsheet experiences within their applications, complete with features like data import/export, complex formulas, conditional formatting, and extensive customization options. SpreadJS caters to a wide range of use cases, from financial modeling and data analysis to project management and interactive dashboards, ultimately allowing developers to build feature-rich and user-friendly web applications.
In this blog post, MESCIUS Product Manager Kevin Ashley demonstrates how to enhance an existing Vue app with the ability to import and export XLSX files using SpreadJS. Steps include:
Detailed sample code is included for each step.
View the complete blog and get starting working with Excel files in your Vue applications.
SpreadJS is licensed per developer and includes 1 Year Maintenance (major and minor version releases and unlimited support phone calls). SpreadJS requires an Annual or Perpetual Deployment License. The optional Add-ons are available at an additional cost, and require a SpreadJS license. See our SpreadJS licensing page for full details.
For more information, visit our SpreadJS product page.
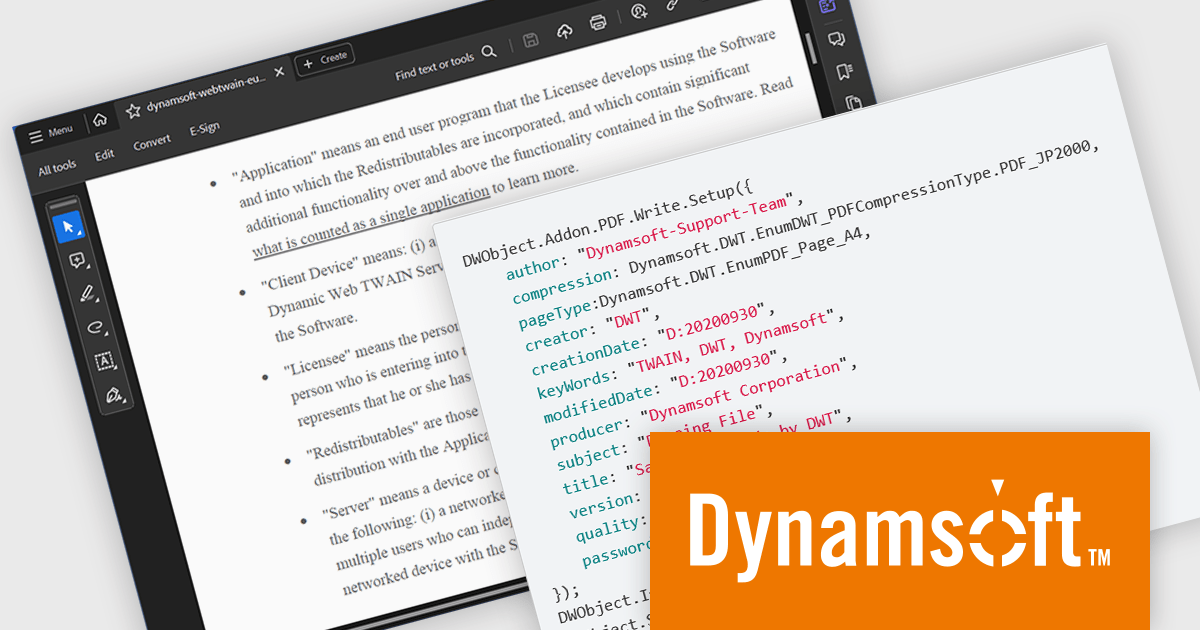
Dynamic Web TWAIN by Dynamsoft is a Software Development Kit (SDK) that simplifies adding document scanning capabilities to your web applications. It offers cross-platform and cross-browser compatibility, allowing users to scan directly from various scanners and webcams using popular browsers like Chrome and Firefox. With just a few lines of JavaScript code, you can integrate powerful scanning features into your web applications, streamlining document management workflows.
The Dynamic Web TWAIN 18.5 release introduces a the ability to generate encrypted PDF files with password protection. This enhancement empowers users to create secure, password-restricted PDFs directly within their applications, eliminating the need for external tools and bolstering data security. This functionality is particularly advantageous for organizations in regulated industries or those handling sensitive information, as it ensures information confidentiality throughout the document lifecycle, from storage and sharing to archiving.
To see a full list of what's new in version 18.5, see our release notes.
Dynamic Web TWAIN is licensed per Client Device and is available as an Annual license. See our Dynamic Web TWAIN licensing page for full details.
For more information, visit our Dynamic Web TWAIN product page.

Progress Telerik is a leading software publisher that provides a range of tools and solutions to help developers build and deploy modern applications. Its product range include UI libraries, reporting tools and testing frameworks. Telerik products are used by millions of developers around the world to build a wide variety of applications.
The 2024 Q2 release completes the blending of AI with UI, thereby bridging the gap between an app and next-generation AI language model applications. The new "AIPrompt" component allows you to integrate artificial intelligence prompts into web, mobile and desktop applications, providing users with a modern interface to interact with AI services.
The following Telerik products have been updated with the AI Prompt component:
To see what else is new in 2024 Q2, see our release notes:
Telerik products are licensed per developer and are available as perpetual licenses with a one year support subscription, which is available in three tiers: Lite, Priority or Ultimate. For more information see:
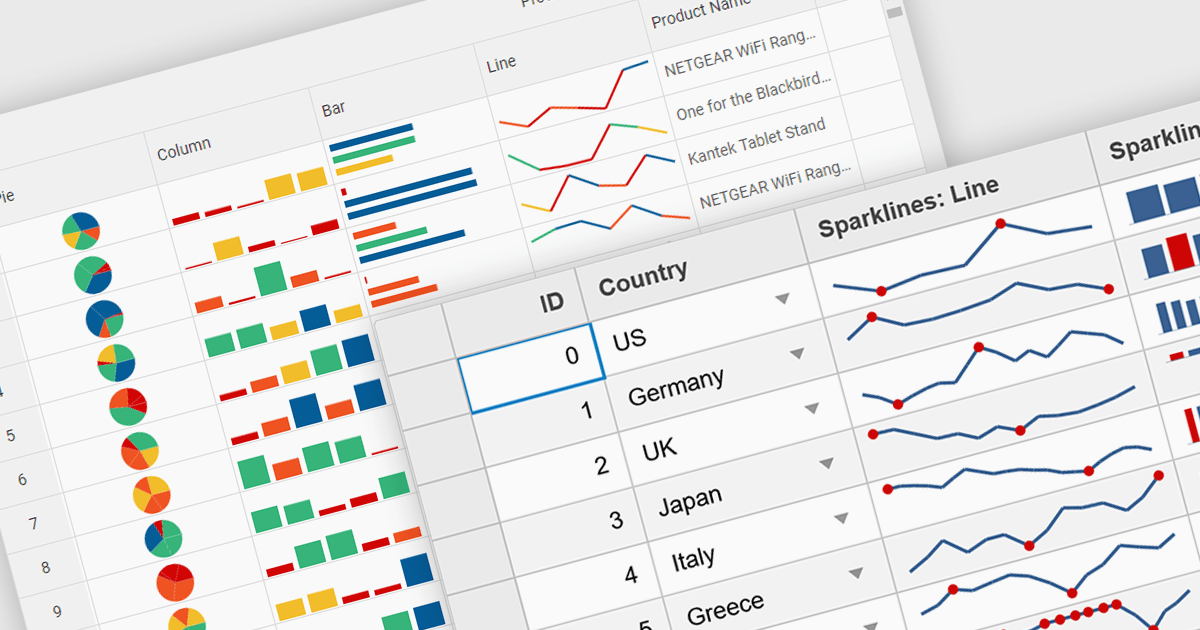
Sparklines are miniature charts embedded directly within grid cells, providing a quick visual summary of data trends within a larger dataset. These tiny line graphs, often lacking axes or detailed labels, condense information into a highly space-efficient format, allowing viewers to grasp patterns and fluctuations at a glance across multiple rows and columns of a grid.
Several Vue.js grid controls offer support for sparklines including:
For an in-depth analysis of features and price, visit our Vue.js Grid controls comparison.
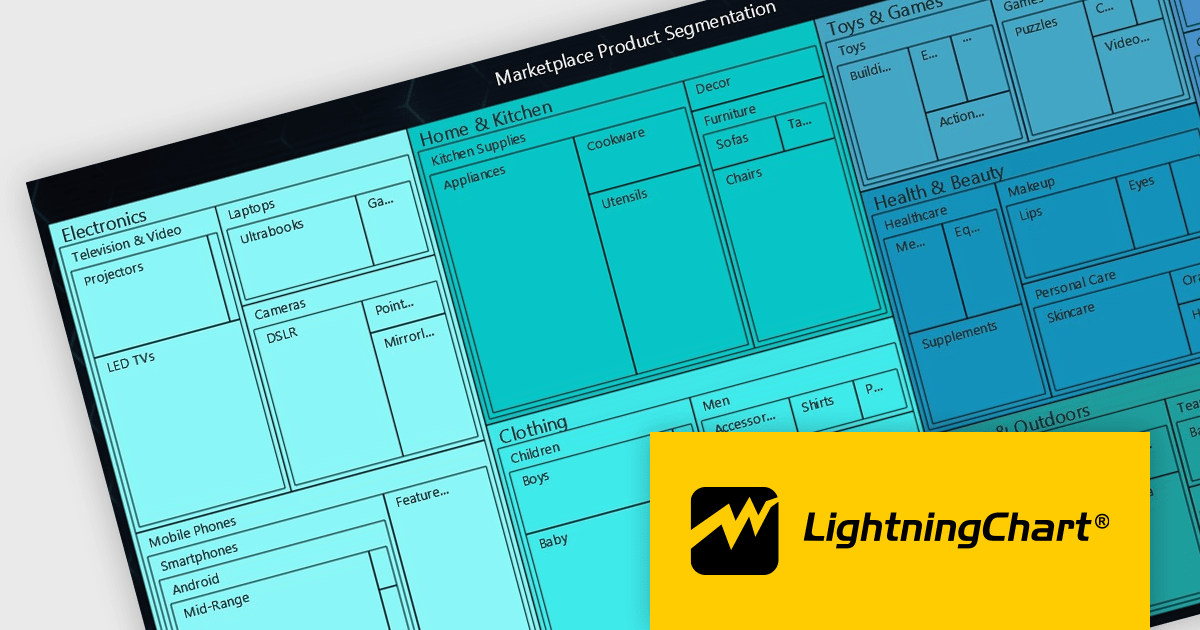
LightningChart JS is a high-performance JavaScript charting library that utilizes WebGL rendering and GPU acceleration to deliver exceptional performance for a wide range of data visualization needs. It is designed to handle large datasets and complex visualizations with ease, enabling developers to create interactive and visually appealing charts for various applications.
The LightningChart JS v5.2.0 update adds Treemap charts with built-in drill-down functionality, enabling developers to visualize hierarchical data within nested rectangles representing larger or smaller values, depending on their size. This simplifies the complexities involved in understanding large datasets by providing a clear and immediate visual hierarchy of data categories and their relative importance, with the ability to display more depth. This is particularly useful in scenarios such as financial analysis, asset distribution, and organizational structure mapping, where understanding the proportionate distribution of data elements is crucial.
To see a full list of what's new in v5.2.0, see our release notes.
LightningChart JS is licensed based on method of deployment with options including SaaS Developer Licenses, Application Developer Licenses, and Publisher Developer Licenses. Each license is perpetual and includes 1 year subscription for technical support and software updates. See our LightningChart JS licensing page for full details.
Learn more on our LightningChart JS product page.
聯繫電話: (888) 850 9911
傳真: +1 770 250 6199


