


官方供應商
我們作為官方授權經銷商,直接提供超過200家開發廠家所發行超過1000個的產品授權給您。
請參閱我們所有的品牌。

dotConnect for Oracle is a high-performance ADO.NET data provider and Object Relational Mapping (ORM) enabled data provider for Oracle databases. It provides a complete solution for developing Oracle-based database applications, offering a range of features that enhance productivity and simplify the development process.
Version 10.2.0 adds support for Oracle Database 23c, meaning you can now connect your .NET applications to the latest version of Oracle's popular database. Oracle Database 23c empowers developers with simplified AI integration and enhances its converged database capabilities, while maintaining its reputation for high availability, performance, and security.
To see a full list of what's new in version 10.2.0, see our release notes.
For more information, visit our dotConnect for Oracle product page.
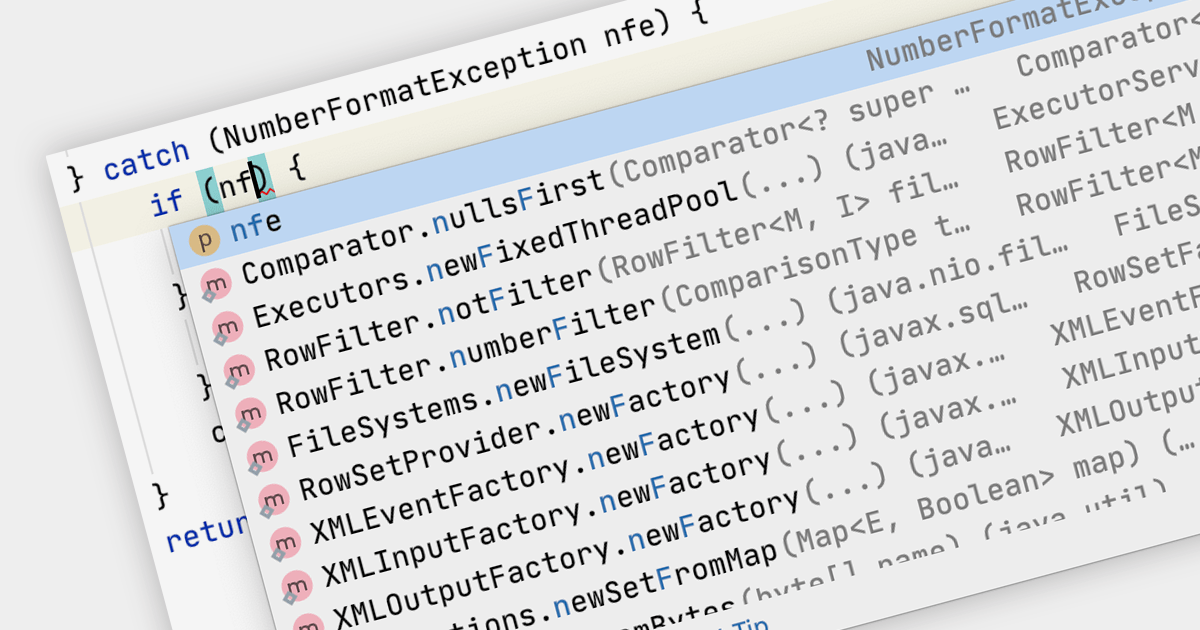
Code Completion is a feature in IDEs that predicts the code you're trying to write and offers suggestions to complete it. This accelerates the coding process, reduces typos, and enhances developer productivity by minimizing the amount of code that needs to be typed manually.
Several IDEs support code completion including:
For an in-depth analysis of features and price, visit our IDEs comparison.

dotConnect for SQL Server is a powerful and versatile data access provider for SQL Server that offers a range of features and benefits to developers. It is based on ADO.NET technology and provides a complete solution for developing SQL Server-based database applications.
Version 5.0.0 adds support for SQL Server 2022, meaning you can now benefit from the latest features and enhancements when connecting your .NET apps to SQL Server. These improvements include temporal tables and queries, which allow developers to analyze historical data efficiently and effectively, as well as support for Azure Synapse Link.
To see a full list of what's new in version 5.0.0, see our release notes.
For more information, visit our dotConnect for SQL Server product page.
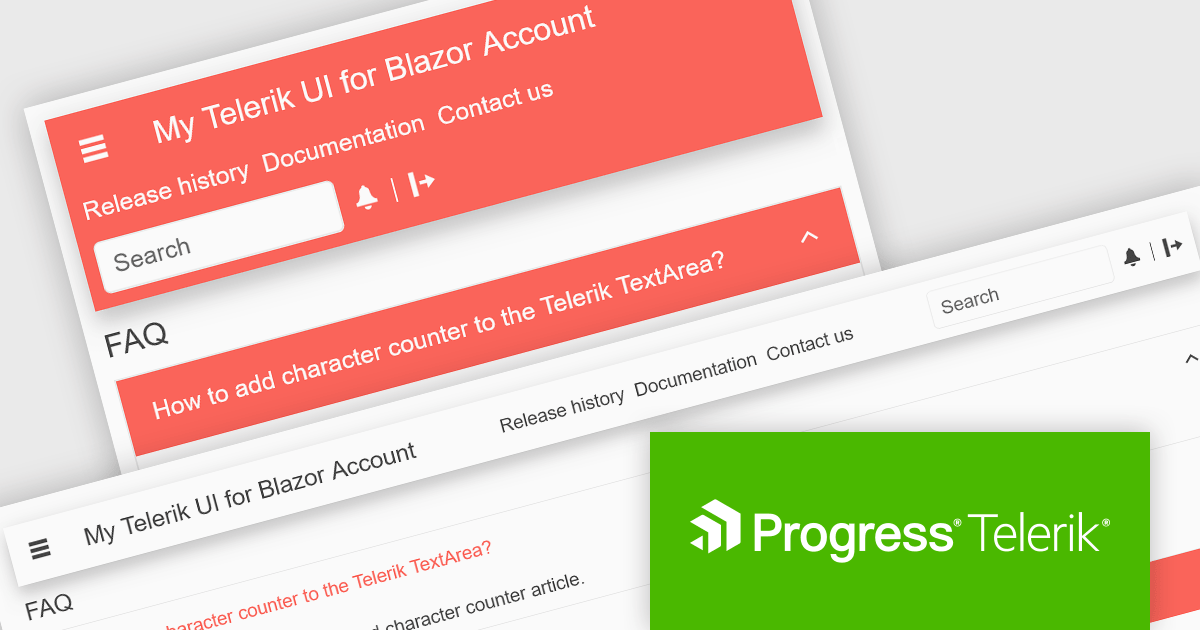
Telerik UI for Blazor is a comprehensive UI library that provides over 110 native Blazor components for building modern and feature-rich web applications. This professional-grade solution offers a complete set of components to satisfy all user interface requirements, saving time and effort in UI design.
Telerik UI for Blazor R3 2023 SP1 (v5.0.0) introduces the AppBar component, empowering developers to create personalized navigation bars that seamlessly integrate with their application's design. The AppBar is fully customizable with control over height, width, position, theme color, and layout, the ability to choose between sticky, fixed, or static behavior, and the option to define and reorder navigation items for an optimal navigation flow. The new component delivers a seamless and visually appealing navigation experience that allows users to effortlessly navigate your application, switch between screens, and maintain contextual awareness throughout their journey.
To see a full list of what's new in R3 2023 SP1 (v5.0.0), see our release notes.
Telerik UI for Blazor is available to buy in the following products:

Rebex designs and develops high-quality software components for .NET developers. Its products include SFTP, FTP, HTTPS, IMAP, POP3, SMTP, TLS, SSH, Terminal emulation, and security components. Rebex products are used by thousands of developers at more than 10,000 ISVs, corporations, and educational, governmental and non-profit organizations around the world.
The following Rebex products have been updated with support for .NET 8, allowing developers to build communications and security applications in the new release version of Microsoft's popular .NET ecosystem:
聯繫電話: (888) 850 9911
傳真: +1 770 250 6199


