


官方供應商
我們作為官方授權經銷商,直接提供超過200家開發廠家所發行超過1000個的產品授權給您。
請參閱我們所有的品牌。
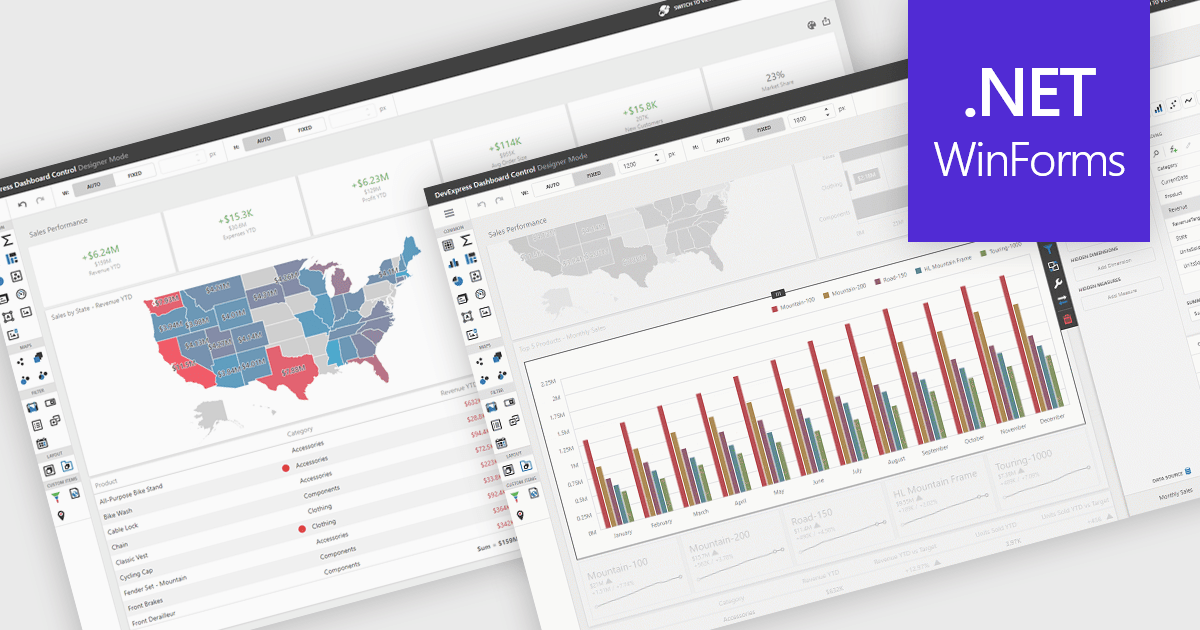
UI layouts define the structural arrangement of elements within an application, determining how content, controls, and navigation are organized and presented to users. A well-designed layout ensures consistency, responsiveness, and usability across different devices and screen sizes, making applications more intuitive and efficient to interact with. Benefits include improved user experience through predictable navigation and flexibility to scale as application requirements evolve. For example, dashboards can automatically adjust width and height to fit available space, web apps can employ responsive grid systems to adapt to mobile and desktop displays, and enterprise software can apply consistent layouts across modules to improve complex processes.
Several .NET WinForms UI suites offer layout components including:
For an in-depth analysis of features and price, visit our .NET WinForms UI suites comparison.
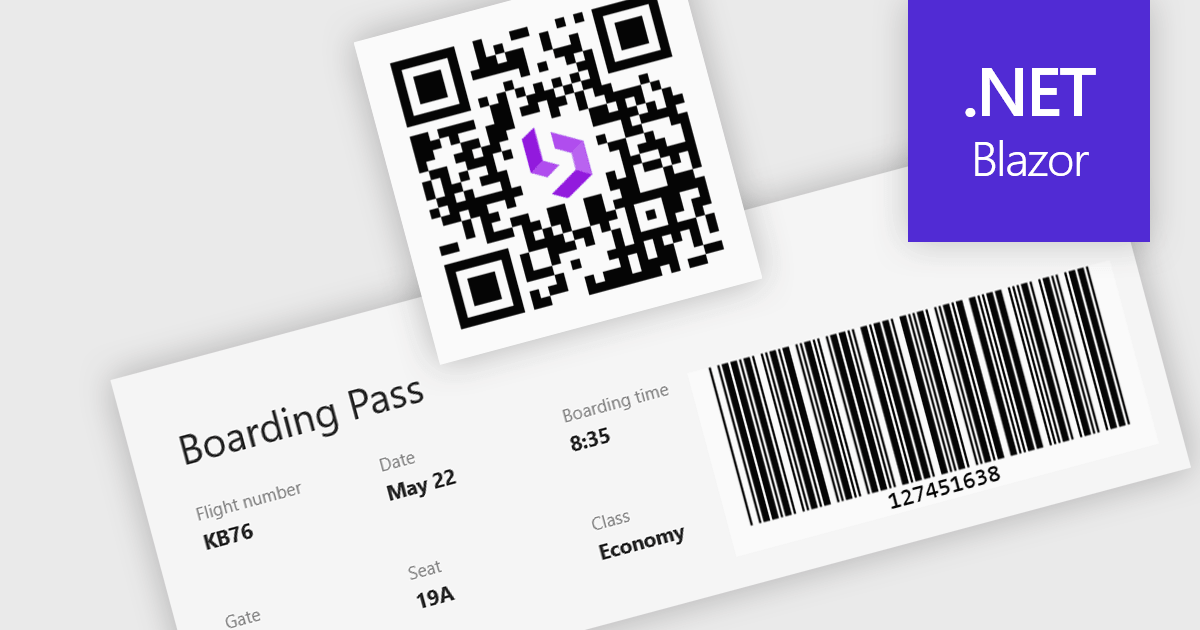
Barcode support in a Blazor UI suite refers to built-in components or controls that enable developers to generate and display barcodes directly within applications. This functionality simplifies the integration of barcode-based processes in retail, logistics, healthcare, and inventory management systems by allowing data encoding and visualization without relying on third-party tools. For software developers, the key benefit is faster implementation of barcode features with consistent styling and customization options, helping maintain application cohesion while supporting machine-readable data formats.
Several Blazor UI suites provide barcode functionality, including:
For an in-depth analysis of features and price, visit our comparison of Blazor UI suites.
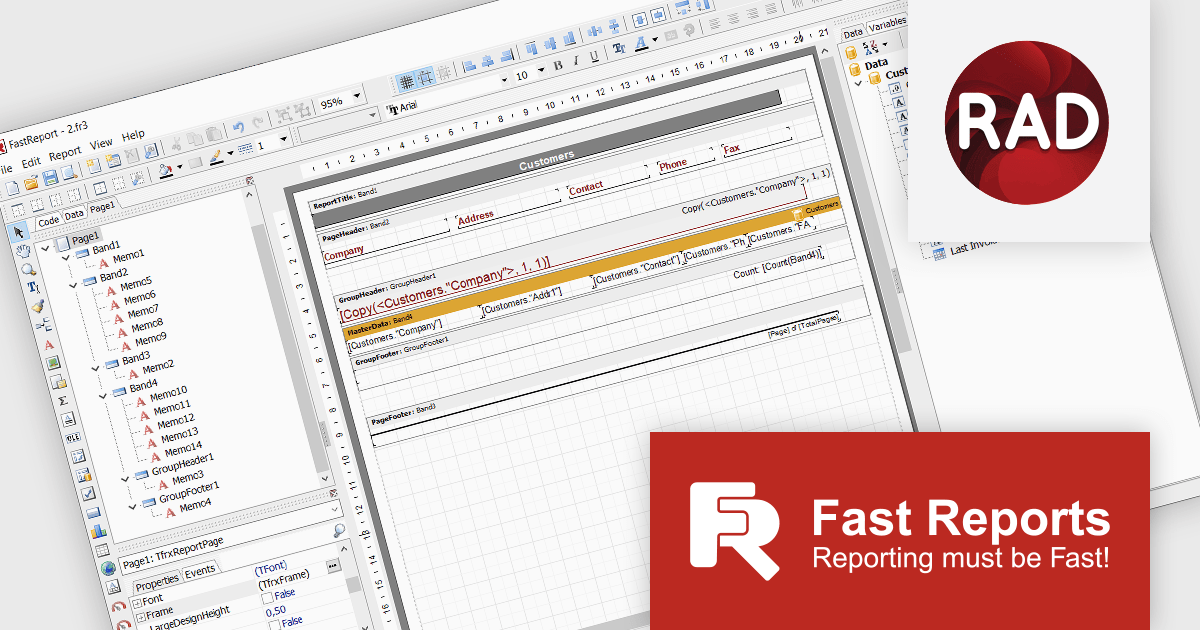
FastReport VCL Ultimate is a comprehensive reporting toolkit designed for Delphi, C++Builder, VCL, FMX (FireMonkey) and cross‑platform business applications. It provides a visual report designer, a rich set of report bands (headers, footers, detail, nested reports, masters/detail, etc.), a powerful scripting engine (PascalScript, C++ Script, BasicScript, JScript), export to many formats (PDF, XLSX, DOCX, HTML, SVG, image formats, etc.), interactive preview/print capabilities, and built‑in client‑server components. It also includes FastCube for multidimensional analysis and advanced filtering, sorting, style inheritance, and cloud storage / transport options for reports.
The FastReport VCL v2025.2.7 release adds support for Embarcadero RAD Studio 13, enabling developers to work confidently with the latest compilers, language updates, and IDE features. By aligning with the new environment, FastReport VCL is designed to preserve design-time integration and runtime behavior, helping reduce migration risk and ongoing maintenance when upgrading existing projects. At the same time, it opens the door to RAD Studio 13’s newest tools, debugging capabilities, and performance improvements, allowing developers to create and deliver reports, scripts, and embedded report designer components on a modern, fully supported platform.
To see a full list of what's new in v2025.2.7, see our release notes.
FastReport VCL Ultimate is licensed per named user and is available as a Perpetual license with 1 year of technical support and product updates. See our FastReport VCL Ultimate licensing page for full details.
Learn more on our FastReport VCL Ultimate product page.
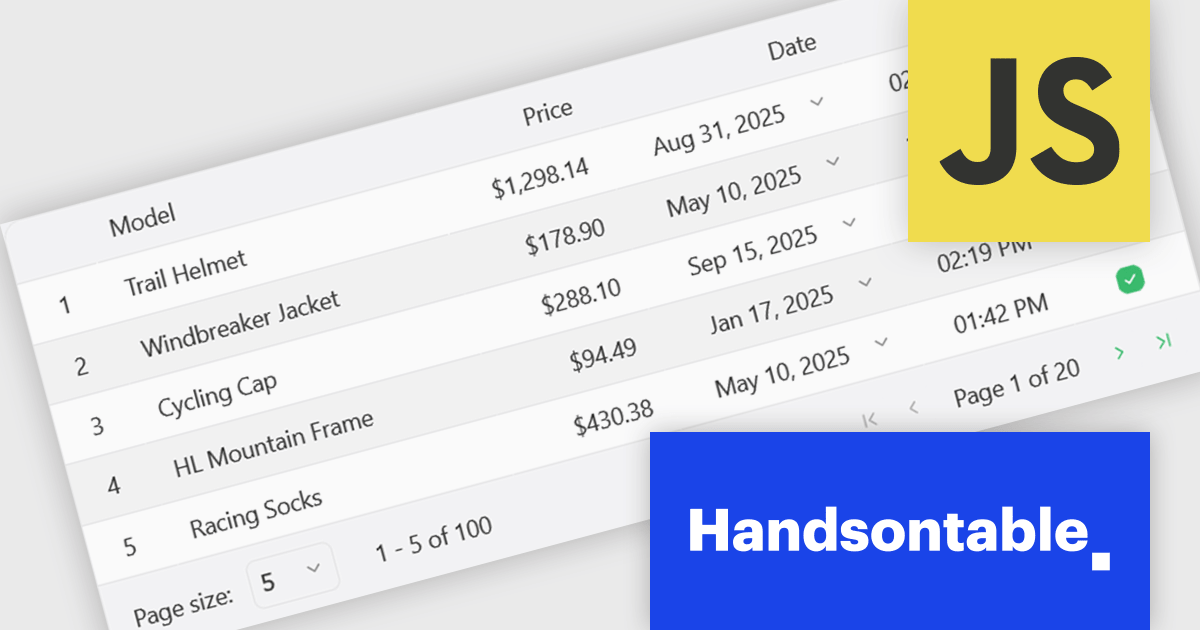
Handsontable is a JavaScript library designed to help developers build interactive data grids into their web applications. Offering a familiar spreadsheet-like interface, it allows users to edit, sort, and filter data with ease. Highly customizable and compatible with popular frameworks like React and Angular, Handsontable empowers developers to build robust data manipulation features into their web applications.
The Handsontable 16.1.0 update brings client-side row pagination, allowing users to divide large tables into smaller, more manageable chunks. This feature is especially beneficial when working with high-volume data, as it improves rendering speed and ensures smoother interaction. By enabling page-based navigation within the grid, developers can maintain a responsive user interface even as datasets scale up significantly.
To see a full list of what's new in version 16.1.0, see our release notes.
Handsontable is licensed per developer and is available as an Annual or Perpetual license with 1 year support and maintenance. See our Handsontable licensing page for full details.
For more information, visit our Handsontable product page.
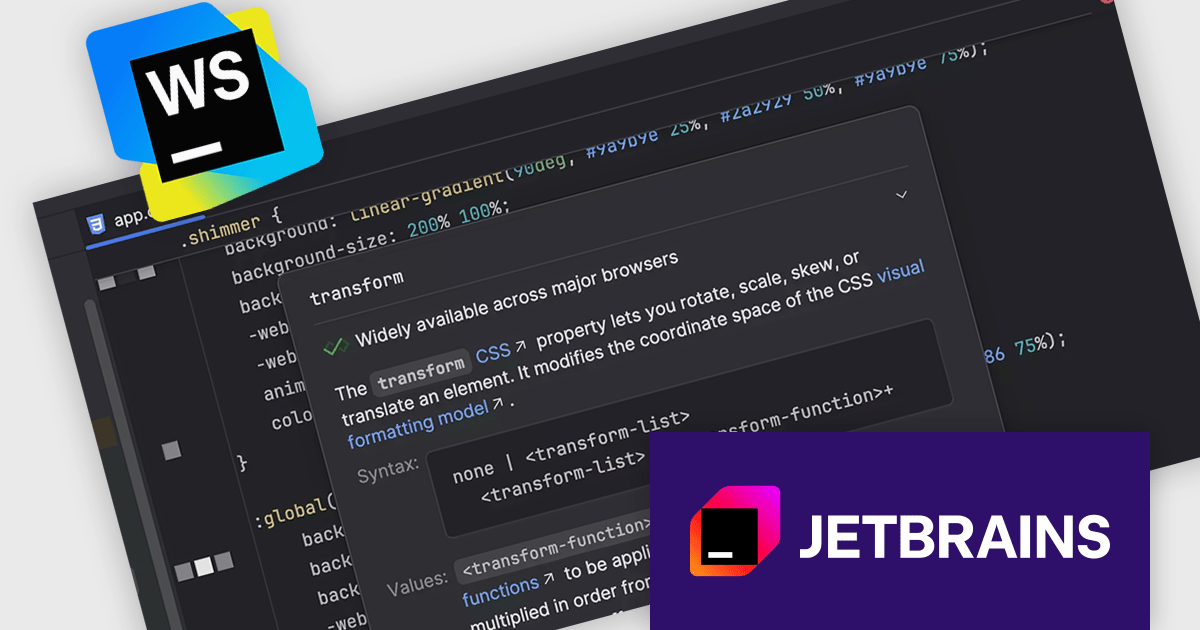
JetBrains WebStorm is a powerful and modern Integrated Development Environment (IDE) specifically designed for web development. It offers a feature-rich environment that supports popular web technologies like JavaScript, HTML, CSS, and Node.js. WebStorm helps you write cleaner, more efficient code with features including syntax highlighting, auto-completion, code refactoring, and built-in testing tools. It integrates seamlessly with various web frameworks and libraries, making it a versatile choice for both front-end and back-end development.
In the latest version of WebStorm, you’ll now see Web Platform Baseline details directly in the quick documentation popup. When hovering over any web API, you’ll immediately learn when the feature reached reliable support across major browsers - thanks to Baseline data from WebDX. This helps you code with confidence that current major browsers support your APIs and that the apps you build can be used widely.”
WebStorm is licensed per user, and is available as a commercial annual subscription license. We can supply new subscriptions, subscription renewals, lapsed renewals, and additional user licenses. See our WebStorm licensing page for full details.
WebStorm is available to buy in the following products:
聯繫電話: (888) 850 9911
傳真: +1 770 250 6199


