


官方供應商
我們作為官方授權經銷商,直接提供超過200家開發廠家所發行超過1000個的產品授權給您。
請參閱我們所有的品牌。
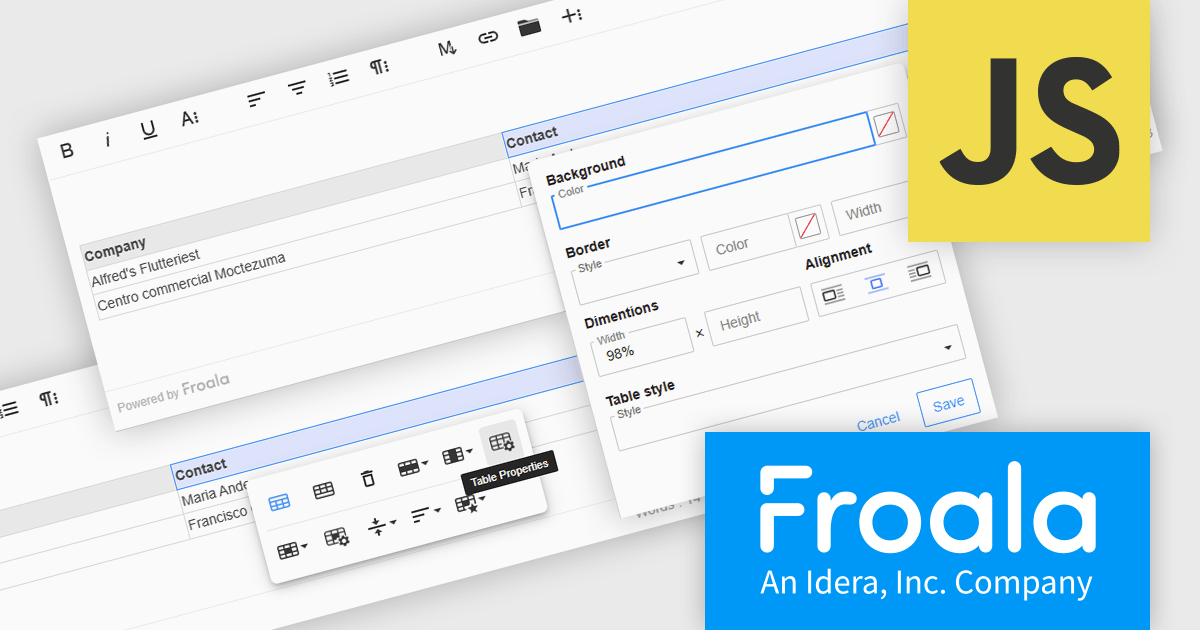
Froala Editor is a JavaScript-based WYSIWYG HTML editor that empowers developers to seamlessly integrate rich text editing functionalities into their applications. Despite its extensive feature set of over 100 options, Froala prioritizes user experience through a cleverly designed toolbar. Actions are categorized into four intuitive scopes, ensuring every feature is readily accessible while maintaining a clean and uncluttered interface. This balance of power and usability makes Froala Editor a versatile solution for a wide range of content creation scenarios.
The Froala Editor 4.6.0 update introduces a highly configurable Table Properties modal that brings detailed table customization into a single, accessible interface. Activated via the table toolbar, this modal lets users set background colors using a color picker that supports both RGB and hex values, applying changes uniformly across all cells. Table borders can now be precisely styled with user-defined color, thickness, and style options such as solid, dotted, dashed, and more. Users can also define table width and height in pixels or percentages, ensuring responsive layouts that adapt to various screen sizes. Alignment controls allow tables to be positioned left, center, or right within the content area. For enhanced readability, especially in data-intensive scenarios, alternating row colors can be toggled on or off to visually separate content. This update gives developers and content creators the granular control needed to create well-structured and visually consistent tables.
To see a full list of what's new in 4.6.0, see our release notes.
Froala Editor is licensed per product and domain. It is available as an annual or perpetual license with version upgrades and support. See our Froala Editor licensing page for full details.
For more information, visit our Froala Editor product page.
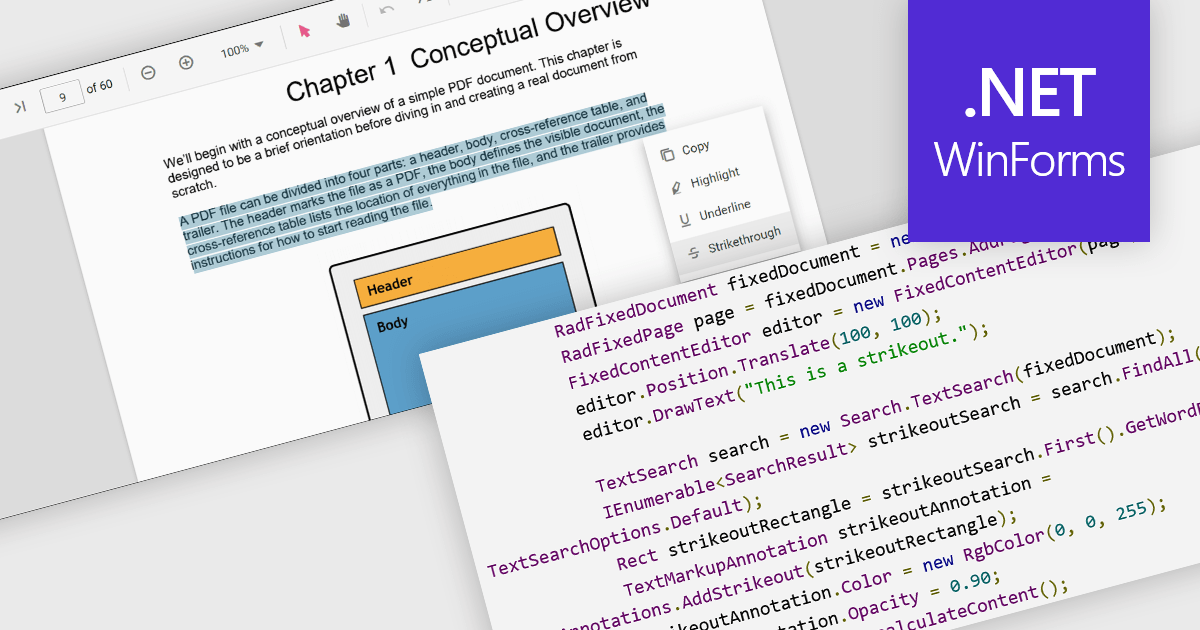
At a high level, strikethrough annotations, also known as strikeout or line-through markups, enable reviewers to visually indicate deletions or corrections within PDF text while preserving the underlying content. This annotation type belongs to the broader category of text markup annotations, which also includes highlighting, underlining, and squiggly underlines. Developers can customize properties like color, opacity, and associated notes or author metadata. Strikethrough annotations support interactive use cases, such as insert/edit/delete, event handling, and rendering consistency across different rendering engines.
Several WinForms PDF controls offer support for strikethrough annotations including:
For an in-depth analysis of features and price, visit our WinForms PDF controls comparison.
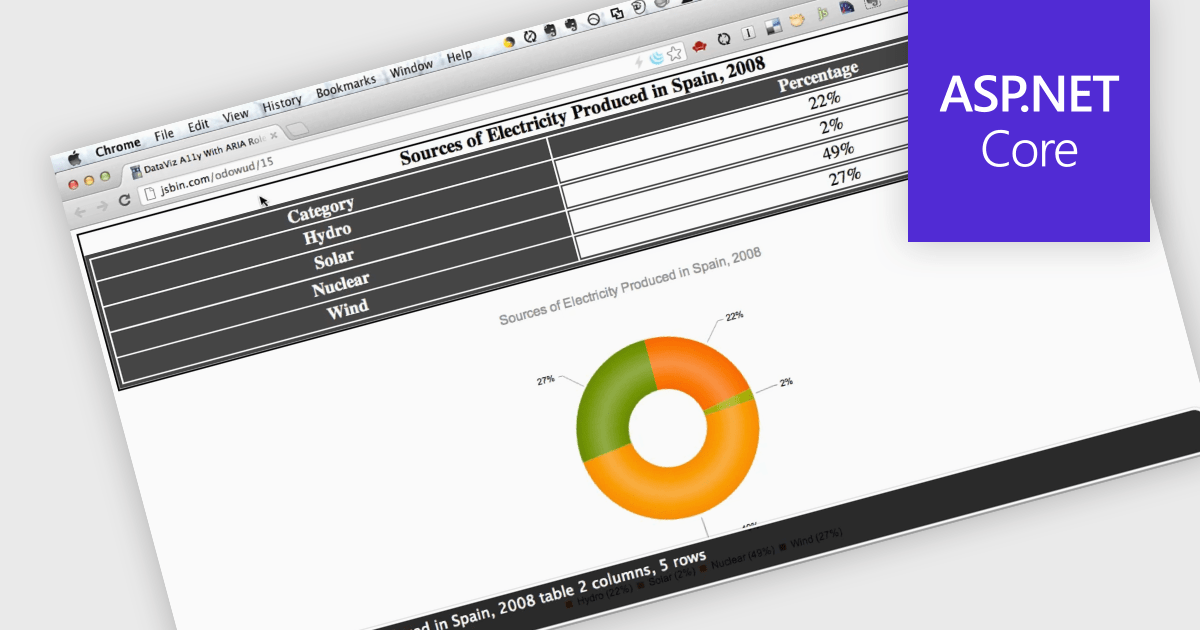
Screen readers, in the context of charts, are assistive technologies that convert digital text and interface elements into speech or braille, allowing users with visual impairments to navigate and understand graphical data on the screen. This involves adding semantic structure, descriptive labels, and metadata so the chart's content can be understood through auditory feedback, enabling users with visual impairments to understand trends, values, and relationships within the chart without needing to see the visual representation. Proper implementation not only improves usability, particularly in data driven environments, but also supports compliance with established accessibility standards such as WCAG (Web Content Accessibility Guidelines).
Several ASP.NET Core charting components support the use of screen readers, such as:
For an in-depth analysis of features and price, visit our comparison of ASP.NET Core chart components.

JetBrains has announced upcoming pricing adjustments for YouTrack, their issue tracking and project management tool, starting October 1, 2025. Existing Cloud and Server customers can continue using their subscriptions at the current rate until their expiration date. To lock in the current pricing one last time, license administrators can renew before the deadline. After October 1, 2025 all new renewals and additions of users or agents will reflect the updated pricing.
The new pricing is shown below:
| Product | Current SRP | New SRP |
|---|---|---|
| YouTrack Server (15 User License) | $600/€600 | $900/€900 |
| YouTrack Server (25 User License) | $1,100/€1,100 | $1,500/€1,500 |
| YouTrack Server (50 User License) | $2,000/€2,000 | $3,000/€3,000 |
| YouTrack Cloud (15 User License) | $660/€660 | $810/€810 |
| YouTrack Cloud (25 User License) | $1,100/€1,100 | $1,350/€1,350 |
| YouTrack Cloud (50 User License) | $2,200/€2,200 | $2,700/€2,700 |
SRP = Suggested Retail Price as at August 1st, 2025.
Act Now: To get your new or renewal licenses at the current price, before the price increase!
Click your product in the table above and use the 'Get Quote' form to receive your renewal price, or contact us to discuss new or renewal subscription licensing.
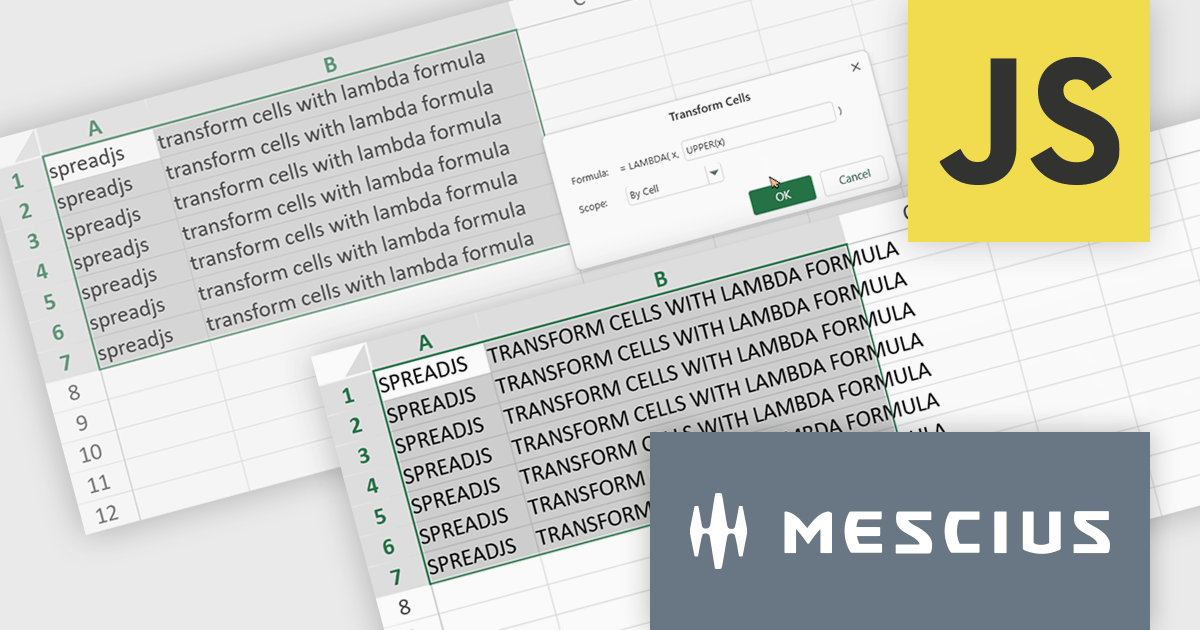
SpreadJS is a high-performance JavaScript spreadsheet and data presentation component designed for enterprise web applications. It enables developers to deliver Excel-like functionality directly within their web solutions, providing advanced features such as data binding, complex calculations, pivot tables, charts, and extensive formatting options. Fully compatible with modern JavaScript frameworks like React, Angular, and Vue, SpreadJS allows seamless integration and customization, empowering development teams to create interactive, data-driven user experiences without relying on external spreadsheet applications.
The SpreadJS 18.2 adds a new Transform command which enables you to apply LAMBDA functions directly to a selected range of cells and replace the original content with calculated results. This simplifies data transformations - whether mapping, filtering, or reshaping - into a clean, single-step process. With this feature, you can select any range and apply a custom LAMBDA formula - for example, converting units, adjusting values, or formatting entries - and have SpreadJS overwrite the selection with the computed results immediately. This removes manual steps like inserting formulas in separate cells, copying values, or pasting back as values. This feature integrates with SpreadJS’s existing LAMBDA capabilities to offer more interactive and efficient spreadsheet manipulation.
To see a full list of what's new in 18.2, see our release notes.
SpreadJS is licensed per developer and includes 1 Year Maintenance (major and minor version releases and unlimited support phone calls). SpreadJS requires an Annual or Perpetual Deployment License. The optional Add-ons are available at an additional cost, and require a SpreadJS license. See our SpreadJS licensing page for full details.
For more information, visit our SpreadJS product page.
聯繫電話: (888) 850 9911
傳真: +1 770 250 6199


