


官方供應商
我們作為官方授權經銷商,直接提供超過200家開發廠家所發行超過1000個的產品授權給您。
請參閱我們所有的品牌。
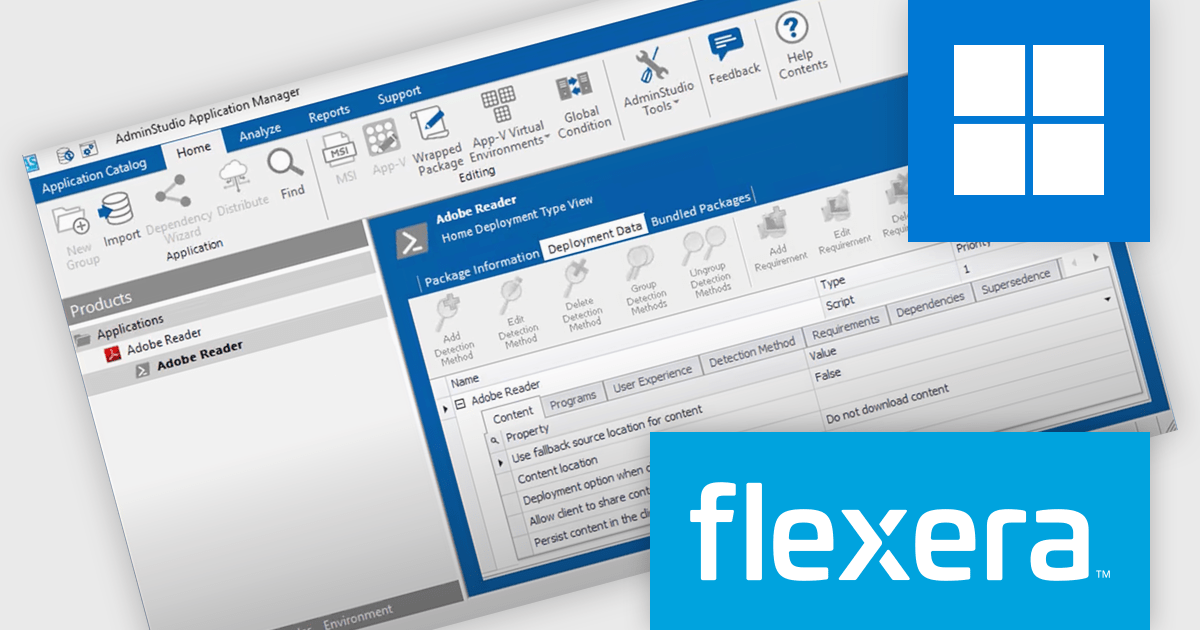
AdminStudio, by Flexera, empowers IT teams to seamlessly and securely package and deploy applications across various platforms. This comprehensive suite automates key processes, from building new packages to testing compatibility and mitigating risks, ensuring efficient and reliable software distribution within your organization. Whether managing physical or virtual applications, AdminStudio simplifies the entire journey, from initial packaging to endpoint delivery, ultimately driving greater efficiency and minimizing deployment risks.
The AdminStudio 2025 R2 release includes a major update to the Package Feed Module (PFM), significantly expanding its library of supported packages from 8,800 to roughly 11,000. This upgrade enhances the breadth of commercial and open-source applications available to IT professionals, offering a more comprehensive foundation for packaging and deployment activities. This extended support means fewer manual tasks for administrators. With automation-ready metadata - such as silent install parameters, detection rules, and uninstall commands - teams can package and deploy software more efficiently across large, varied environments. The upgrade is particularly useful for organizations managing a wide array of applications, as it minimizes the scripting effort typically required during software preparation.
To see a full list of what's new in version 2025 R2, see our release notes.
AdminStudio is licensed per user and is available as a 3 Year Timed Subscription. See our AdminStudio Professional or AdminStudio Enterprise licensing pages for full details.
For more information, visit our product pages:
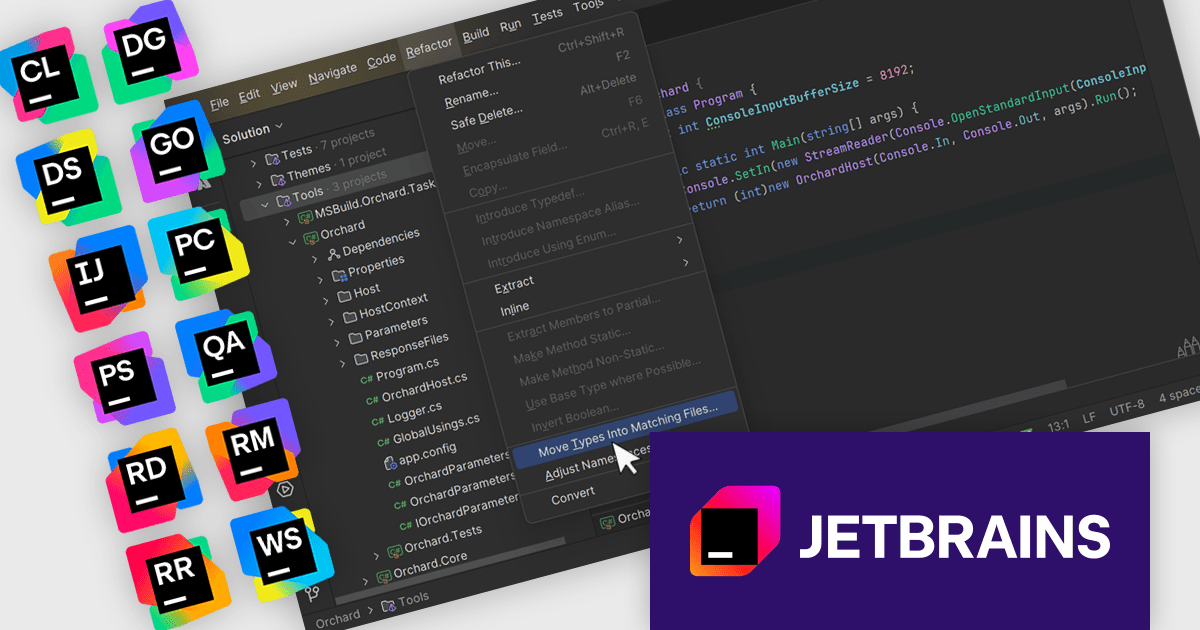
The JetBrains All Products Pack provides access to a comprehensive suite of JetBrains tools, including 12 IDEs, 3 extensions, and 2 profilers, all under one unified license. This flexible solution allows users to switch between tools across multiple machines, adapting to different projects with ease. With a single license, you benefit from simplified license management and significant cost savings - 12 IDEs for the price of two. The All Products Pack is designed to advance your skills by giving you unlimited access to industry-leading professional tools, empowering efficient, high-quality development across a variety of languages and platforms.
The JetBrains All Products Pack enables project-wide refactorings that streamline large-scale code changes by applying consistent updates across the entire codebase. Developers can rename classes, methods, or variables, move files or components, and extract methods without manually tracking each reference, reducing the risk of errors and missed dependencies. Context-aware analysis ensures that changes are applied accurately and safely, preserving functionality while improving code structure. This capability enhances maintainability, accelerates development workflows, and allows teams to adapt their applications efficiently as requirements evolve.
JetBrains All Products Pack is licensed per user as a commercial annual subscription. We can supply new subscriptions, subscription renewals, lapsed subscription renewals, and additional developer licenses. See our JetBrains All Products Pack licensing page for full details.
For more information, see our JetBrains All Products Pack product page.
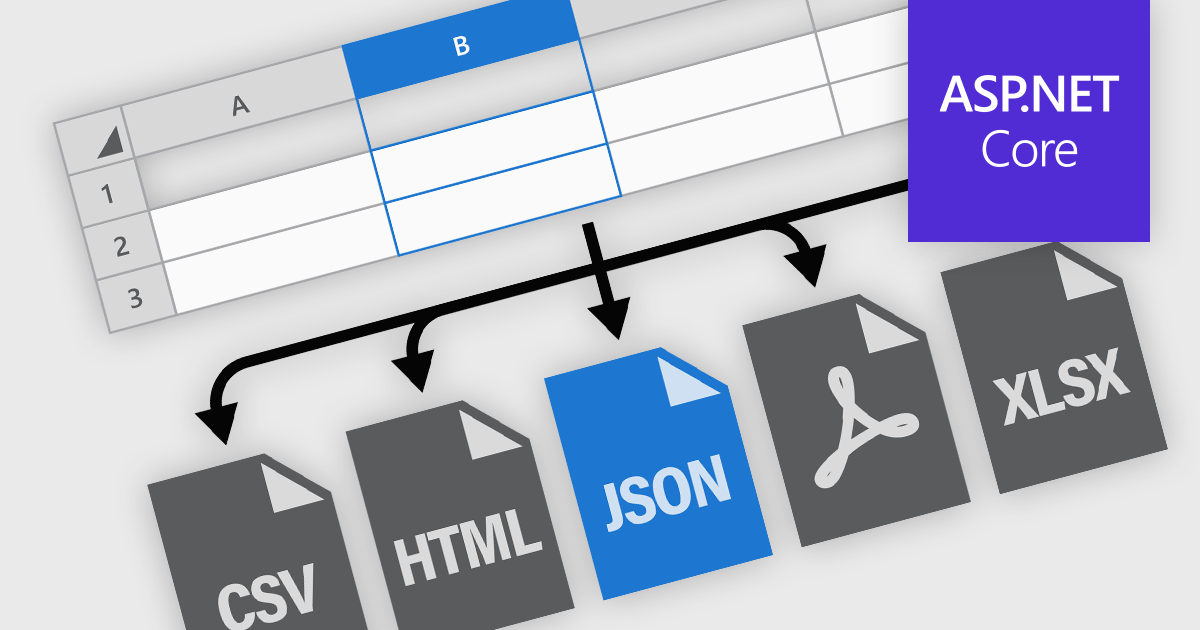
Spreadsheet components in modern UI frameworks offer robust capabilities for exporting and printing data, enabling users to take structured, interactive grid content and transform it into static or sharable formats. These features are crucial in enterprise applications, where end users often need to generate reports, export analysis results, or share datasets in widely recognized formats. Whether integrated into financial dashboards, inventory systems, or business intelligence tools, export and print functionalities ensure that grid data remains portable, consistent, and accessible across various workflows and platforms.
Common features include:
For an in-depth analysis of features and price, visit our ASP.NET Core spreadsheet components comparison.

ComponentSource and Redgate Software have partnered since 2005 to deliver world-class database development and management tools to software teams and IT professionals around the world. This long-standing collaboration focuses on providing tools for database version control, deployment automation, performance monitoring, and data comparison. For over two decades, the partnership has been driven by a shared commitment to helping organizations streamline database workflows, reduce risk, and maintain control over complex data environments.
Redgate Software creates powerful and efficient software to help data professionals get the most value out of any database, anywhere, through the provision of globally respected database management tools. Used by more than 200,000 people worldwide, including 92% of the Fortune 100, Redgate Software solutions ensure database integrity, compliance, and performance. One of Redgate Software's offerings is SQL Toolbelt Essentials, a comprehensive suite that includes tools such as SQL Compare, SQL Prompt, and SQL Data Compare Pro. Designed to support everything from version control and deployment automation to performance diagnostics, SQL Toolbelt Essentials equips development teams and DBAs with everything they need to deliver high-quality database solutions, faster and more reliably.
Over the past two decades, the partnership between ComponentSource and Redgate Software has helped thousands of organizations streamline their database development and management processes through access to trusted, high-quality tools. As a consistently strong performer in the ComponentSource catalog, Redgate Software remains a valued partner, with a shared commitment to supporting data professionals and advancing excellence in SQL Server development and administration for the years ahead.
Learn more about Redgate Software.
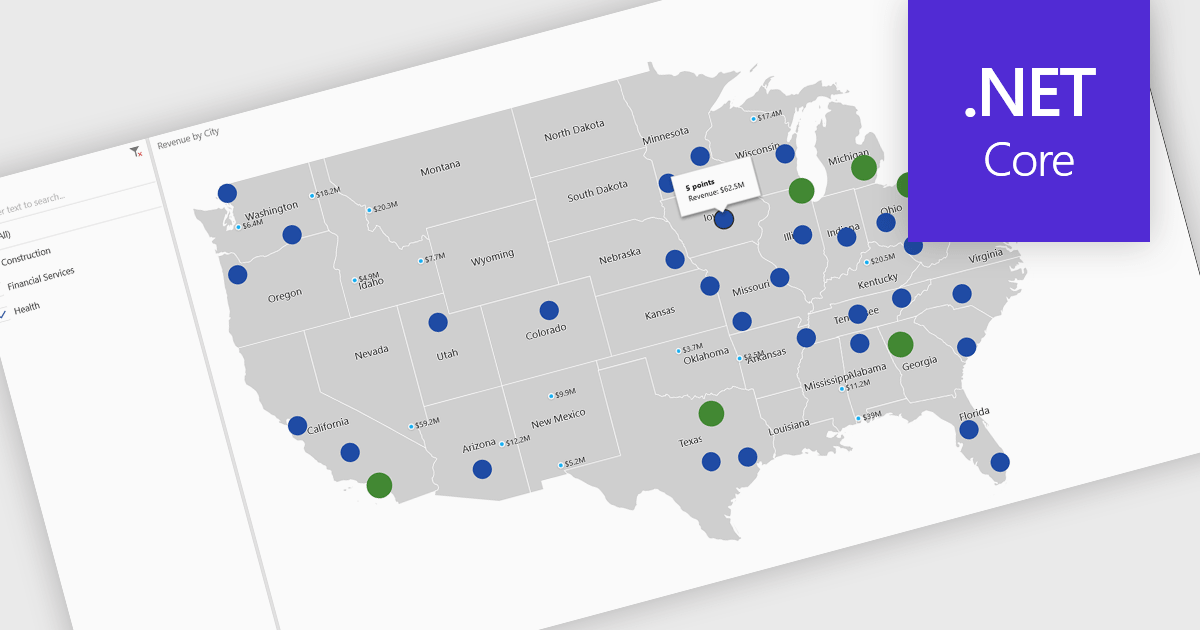
A map chart is a visual representation of data that displays values across geographic regions using colors, shading, or markers, making complex information easier to interpret. By placing data in a spatial context, map charts help users quickly identify regional patterns, trends, and outliers that might be overlooked in traditional tables or graphs. They are particularly useful for comparing values across countries, states, or counties, enabling clearer insights into geographically distributed data. Common use cases include illustrating population density, highlighting election results, analyzing sales performance by region, and presenting economic indicators. The key benefits of map charts include their ability to simplify complex datasets, provide intuitive comparisons, and support data-driven decision-making by visually connecting numbers with real-world locations.
Several .NET Core chart controls offer map charts including:
For an in-depth analysis of features and price, visit our .NET Core chart controls comparison.
聯繫電話: (888) 850 9911
傳真: +1 770 250 6199


