


官方供應商
我們作為官方授權經銷商,直接提供超過200家開發廠家所發行超過1000個的產品授權給您。
請參閱我們所有的品牌。
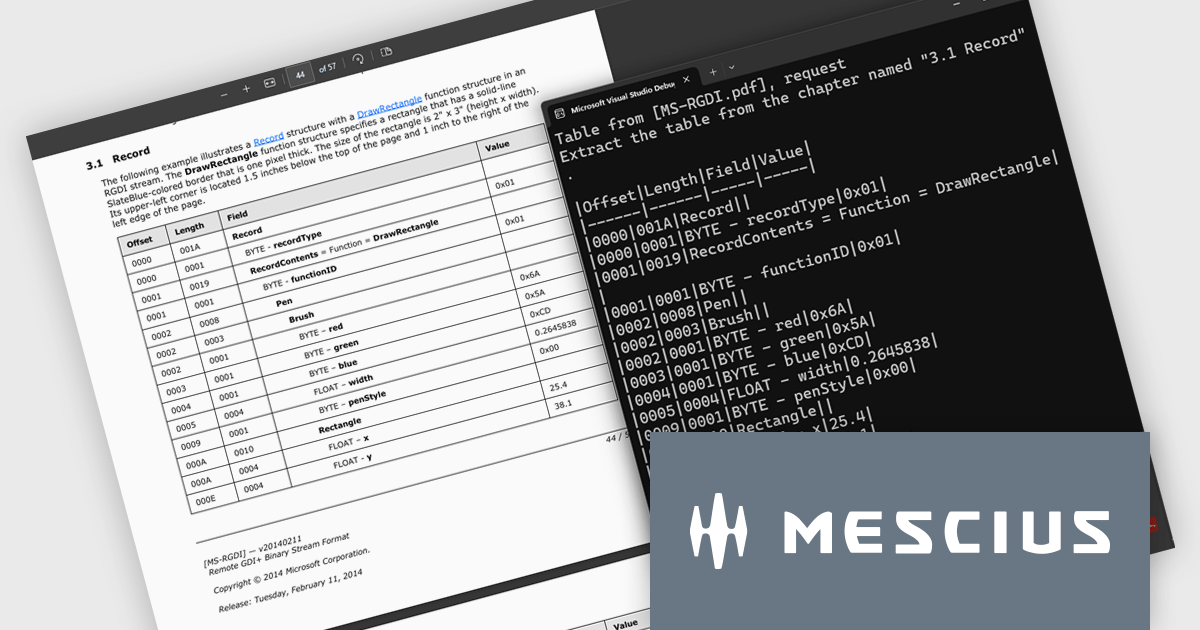
Document Solutions for PDF (DsPdf) by MESCIUS is a software development toolkit that provides .NET Core libraries and a JavaScript PDF viewer for manipulating and displaying PDFs. DsPdf enables developers to create, edit, annotate, and redact PDF documents directly within web applications. The included DsPdfViewer component offers a feature-rich, cross-platform solution for viewing and interacting with PDFs in modern browsers on various operating systems, including mobile devices.
The Document Solutions for PDF v8.2 update introduces a new AI-powered capability to extract tables from documents, enabling developers to convert unstructured tabular data in PDFs into structured, machine-readable formats with ease. By leveraging natural language prompts through OpenAI or Azure OpenAI services, this feature eliminates the need for manual parsing or coordinate-based extraction, reducing development effort. It provides reliable output even from PDFs with complex layouts or inconsistent formatting.
To see a full list of what's new in version 8.2, see our release notes.
Document Solutions for PDF is licensed per developer and is available in several license options for differing distribution needs. Team licenses are also available for multiple developers within the same organization. See our Document Solutions for PDF licensing page for full details.
Document Solutions for PDF is available to buy individually or as part of Document Solutions .NET Bundle.
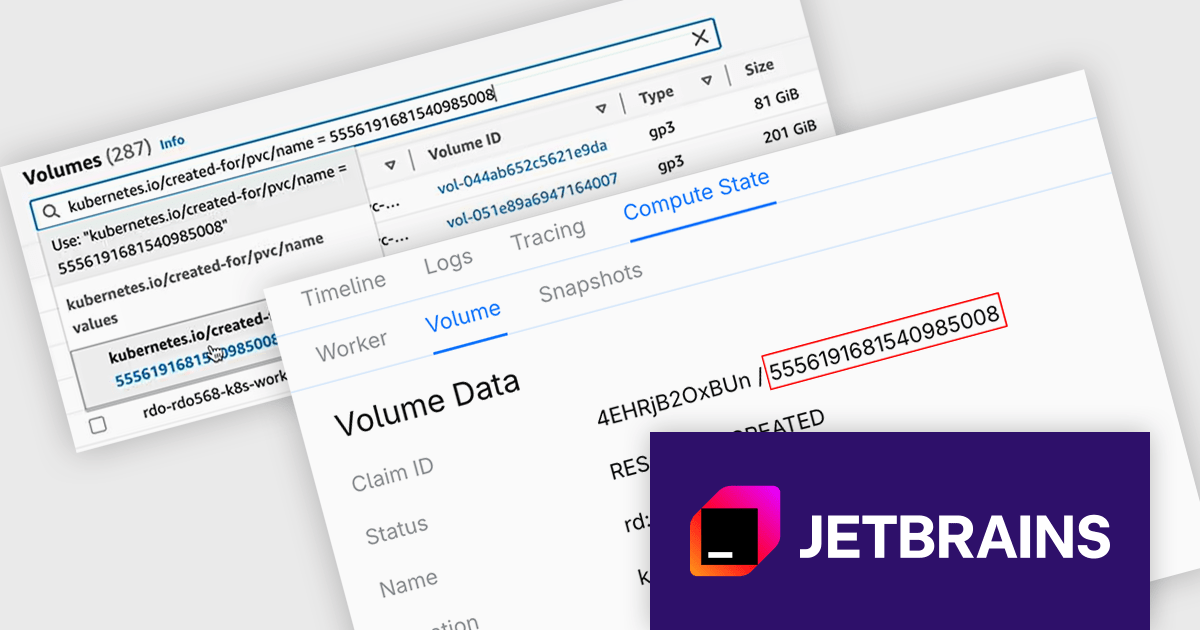
CodeCanvas is JetBrains’ answer to the growing need for scalable, cloud-based development setups that don’t compromise on control or tooling preferences. As a cloud development environment (CDE) orchestrator, it allows teams to spin up consistent and fully configured development environments using their favorite JetBrains IDEs - all within their own infrastructure. This setup significantly reduces the overhead of environment mismatches and local setup time, making it easier for developers to start writing code immediately, no matter where they’re working from.
The CodeCanvas 2025.3 release adds the ability to recover data from failed development environments. If an environment fails to start - whether due to configuration errors, system issues, or other problems - you can now create a dedicated recovery environment that retains the volume of the original setup. This means that any unpushed code or unsaved data left behind can still be accessed, reviewed, and preserved. It's a practical safeguard for developers working in cloud-based workflows, helping to reduce the risk of lost work and ensuring continuity across development sessions.
To see a full list of what's new in version 2025.3, see our release notes.
CodeCanvas is available as an annual subscription license. It uses a floating license model governed by Daily Active Users (DAU). Any user can access CodeCanvas as long as the number of users active on any single day does not exceed the total licenses purchased. The license pool resets every 24 hours, enabling different team members to rotate access. See our CodeCanvas licensing page for full details.
For more information, see our CodeCanvas product page.
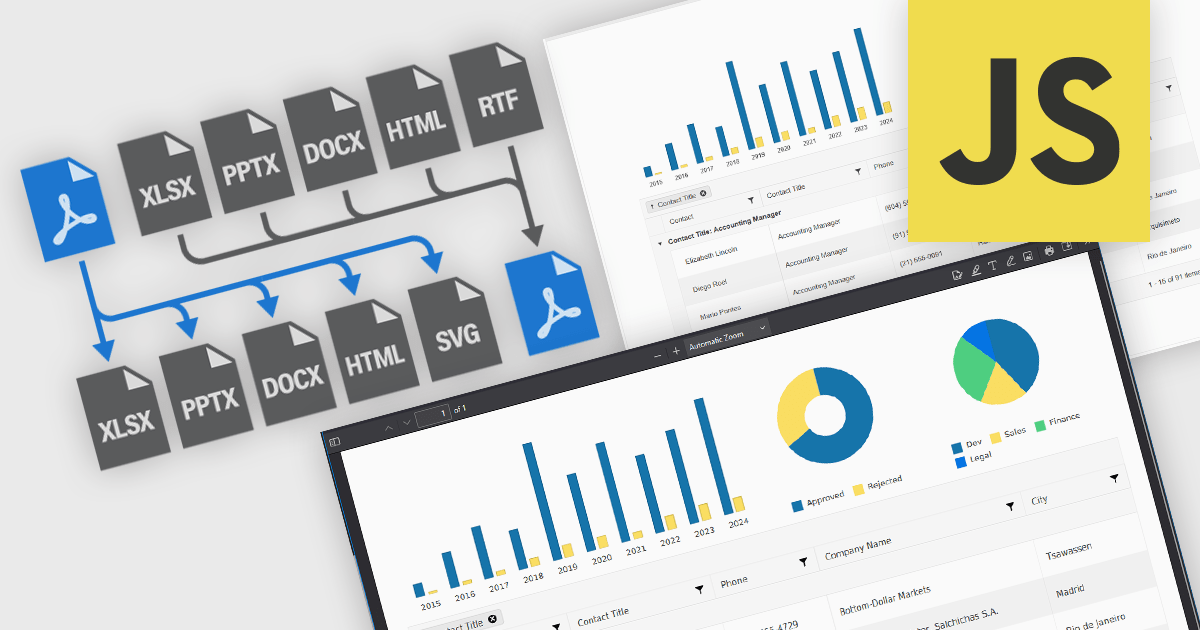
JavaScript PDF components that support format conversion play a critical role in modern web and enterprise applications, allowing developers to programmatically generate, manipulate, and transform documents within the browser or on the server. These tools simplify workflows that require format interoperability, such as generating printable reports from web content, archiving dynamic documents, or extracting data for analysis. Their ability to convert between PDF and other widely used formats ensures compatibility across systems, supports digital transformation goals, and enhances document handling efficiency.
Common conversions include:
For an in-depth analysis of features and price, visit our JavaScript PDF components comparison.
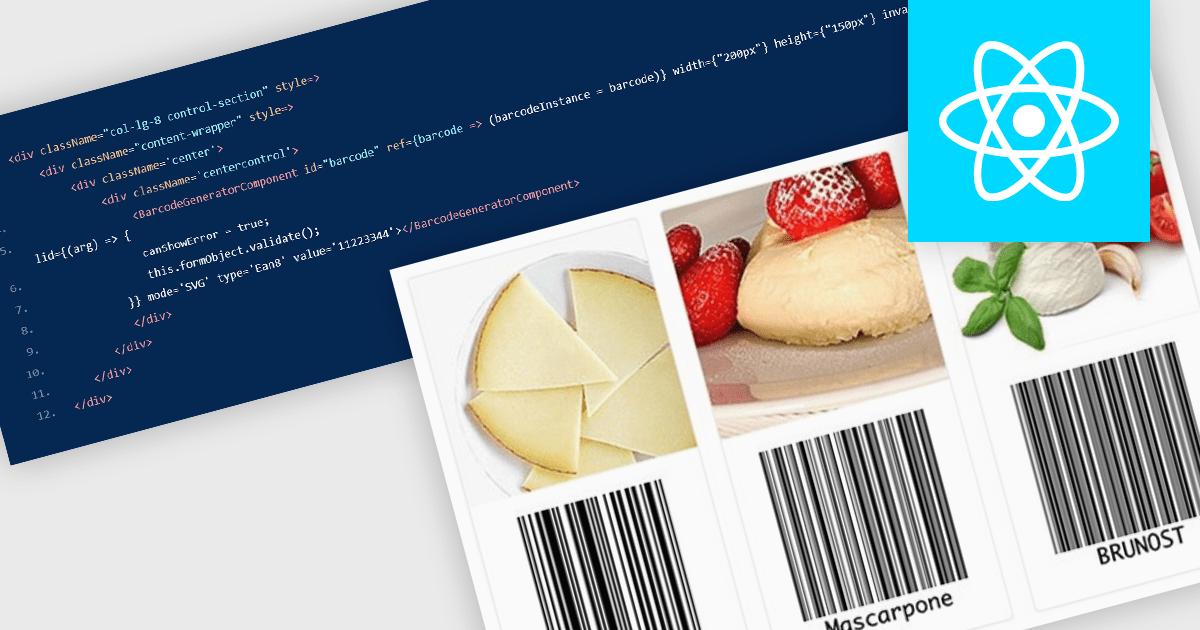
Barcode components in React UI suites deliver a easy way to integrate machine-readable encoding directly into modern web applications. These components offer a high-level interface for rendering both one-dimensional and two-dimensional barcodes, with customizable options for type (symbology), dimensions, styling, and export formats. They enable developers to choose between vector-based (SVG) or bitmap (Canvas) rendering, and often support direct exports to PNG, PDF, or SVG formats. Such features make barcodes a flexible integration point for inventory systems, shipping labels, ticketing, and other use cases requiring reliable, visual encoding of data within React environments.
Several React UI suites offer Barcode components including:
For an in-depth analysis of features and price, visit our React UI suites comparison.
AdminStudio, by Flexera, empowers IT teams to seamlessly and securely package and deploy applications across various platforms. This comprehensive suite automates key processes, from building new packages to testing compatibility and mitigating risks, ensuring efficient and reliable software distribution within your organization. Whether managing physical or virtual applications, AdminStudio simplifies the entire journey, from initial packaging to endpoint delivery, ultimately driving greater efficiency and minimizing deployment risks.
The AdminStudio 2025 R2 release includes a major update to the Package Feed Module (PFM), significantly expanding its library of supported packages from 8,800 to roughly 11,000. This upgrade enhances the breadth of commercial and open-source applications available to IT professionals, offering a more comprehensive foundation for packaging and deployment activities. This extended support means fewer manual tasks for administrators. With automation-ready metadata - such as silent install parameters, detection rules, and uninstall commands - teams can package and deploy software more efficiently across large, varied environments. The upgrade is particularly useful for organizations managing a wide array of applications, as it minimizes the scripting effort typically required during software preparation.
To see a full list of what's new in version 2025 R2, see our release notes.
AdminStudio is licensed per user and is available as a 3 Year Timed Subscription. See our AdminStudio Professional or AdminStudio Enterprise licensing pages for full details.
For more information, visit our product pages:
聯繫電話: (888) 850 9911
傳真: +1 770 250 6199


