


官方供應商
我們作為官方授權經銷商,直接提供超過200家開發廠家所發行超過1000個的產品授權給您。
請參閱我們所有的品牌。
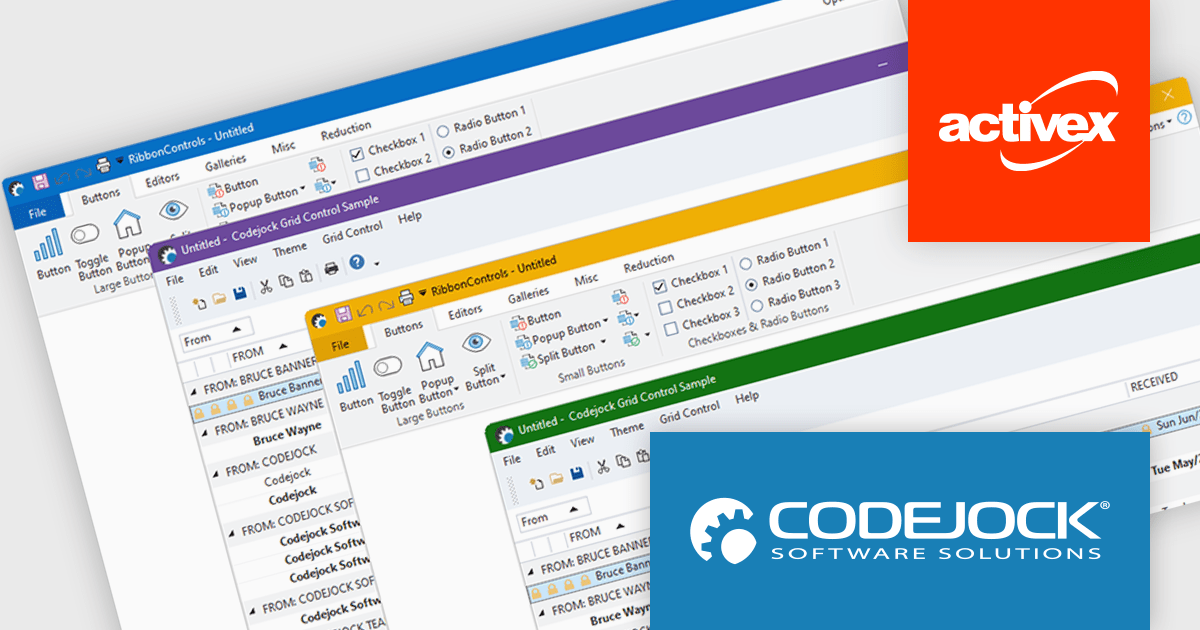
Codejock Suite Pro is a comprehensive collection of UI components and libraries designed to enhance the development process and create visually stunning applications. With a rich array of features including grids, charts, editors, docking windows and more, the suite empowers developers to rapidly build robust and user-friendly interfaces. Whether you're building enterprise applications, data visualization tools or custom user interfaces, Codejock Suite Pro provides the essential tools to elevate your projects and deliver exceptional user experiences.
The Codejock Suite Pro 24.2.0 release brings full support for Windows 11's visual styling, allowing toolbar and ribbon components to adopt both system-defined and user-custom accent colors. This enhancement ensures that applications built with Codejock controls visually align with the modern Windows 11 interface, delivering a more integrated and polished look. Developers can now create interfaces that feel native on Windows 11, helping end users enjoy a cohesive experience across both system and application elements.
To see a full list of what's new in the 24.2.0 release, see our release notes.
Codejock Suite Pro is licensed per developer and is available as a perpetual license with 30 days or 1 year subscription (product updates and phone/email technical support). See our Codejock Suite Pro licensing page for full details.
For more information, visit our Codejock Suite Pro product page.
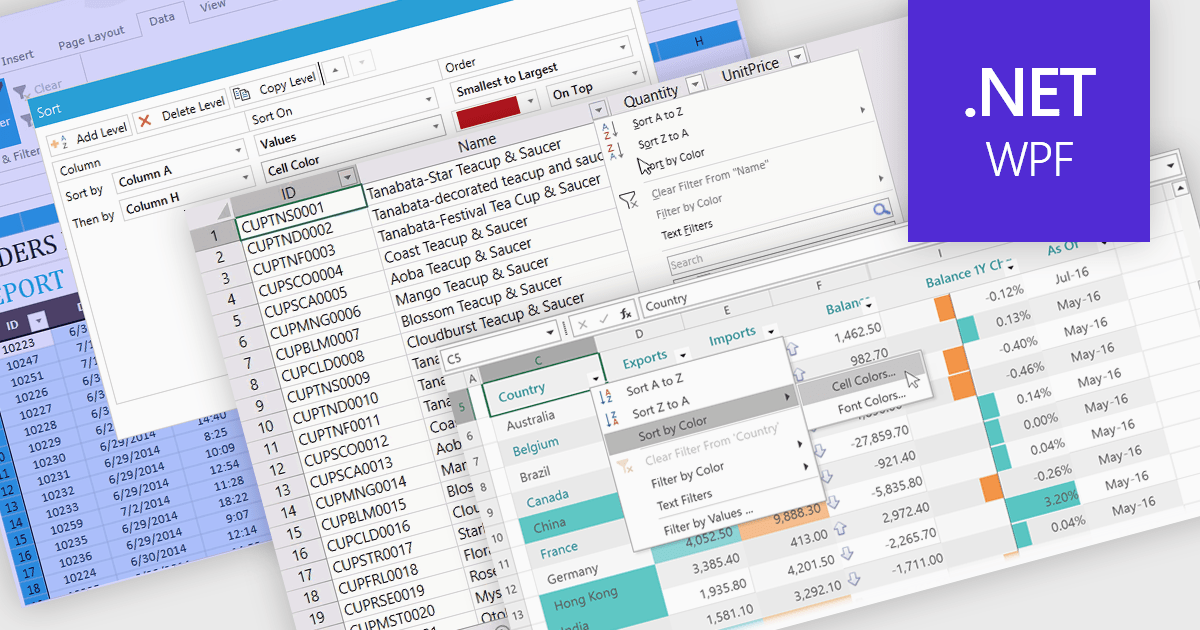
Data sorting in a spreadsheet control is a fundamental feature that enables users to rearrange data within a grid or table based on specific criteria, typically ascending or descending alphabetically or by numerical value. Sorting will usually be performed on single or multiple columns and is often integrated with other data manipulation tools like filtering, grouping, and searching. By sorting data, users can quickly locate and analyze information, identify patterns, and ensure consistency across records. Especially useful in large datasets, it improves the readability of the information and makes it more organized in preparation for decision-making, reporting, and data validation. This capability facilitates efficient data analysis, and supports better user interaction by allowing datasets to be viewed in meaningful sequences.
Several WPF spreadsheet controls offer support for data sorting including:
For an in-depth analysis of features and price, visit our WPF spreadsheet controls comparison.
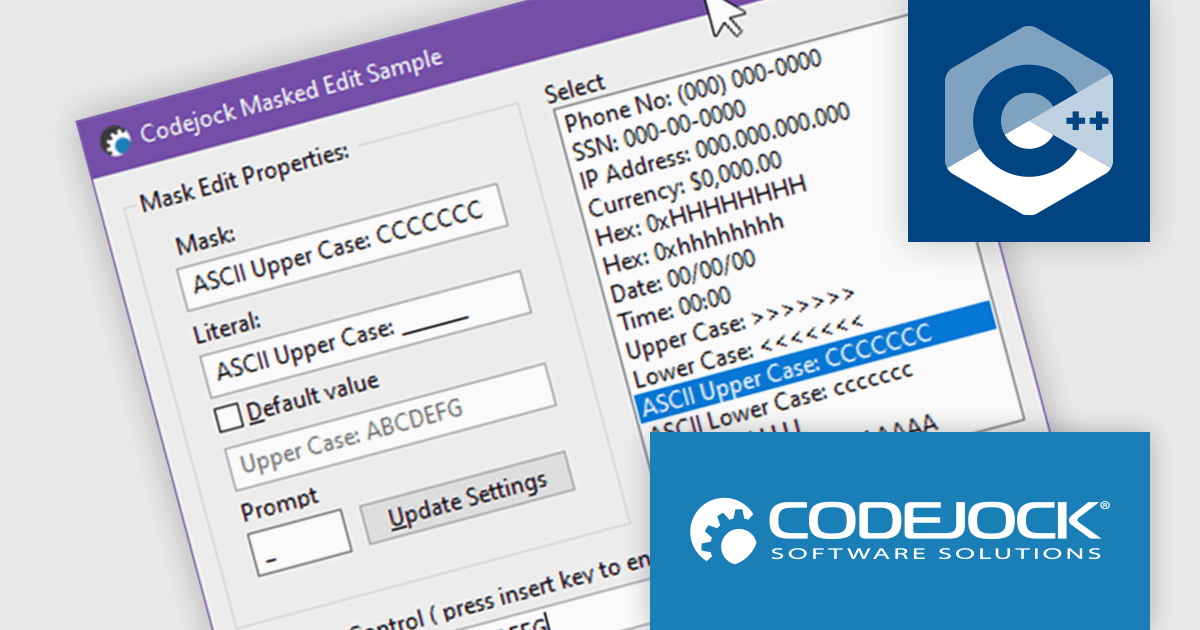
Codejock Toolkit Pro is a comprehensive suite of UI components designed to enhance the development process and create visually appealing, feature-rich applications. The toolkit offers a wide range of controls, including calendars, charts, docking windows and more, each meticulously crafted to provide exceptional performance and customization options. With features like data binding, theming and localization, developers can easily integrate the toolkit into their projects and tailor the interface to meet specific requirements. The toolkit's versatility makes it suitable for various applications, from desktop software to web-based solutions, empowering developers to deliver professional-grade user experiences.
In the Codejock Toolkit Pro 24.2.0 release, the MaskEdit control has been updated to offer expanded support for ASCII characters, allowing for broader and more accurate input validation. Developers can now take advantage of new automatic case conversion options to enforce lowercase or uppercase input without additional scripting. The inclusion of two new modes further improves control over hexadecimal and alphanumeric inputs, making the control more versatile for form fields, serial input, and other structured data entry scenarios.
To see a full list of what's new in the 24.2.0 release, see our release notes.
Codejock Toolkit Pro is licensed per developer and is available as a perpetual license with 30 days or 1 year subscription (product updates and phone/email technical support). See our Codejock Toolkit Pro licensing page for full details.
For more information, visit our Codejock Toolkit Pro product page.
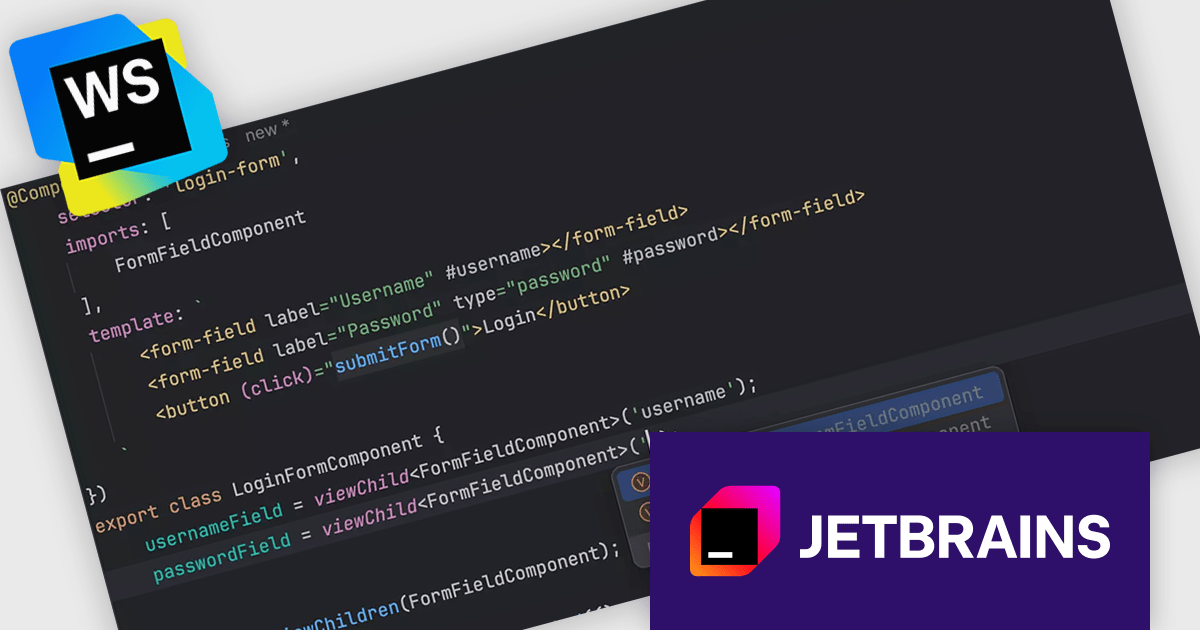
JetBrains WebStorm is a powerful and modern Integrated Development Environment (IDE) specifically designed for web development. It offers a feature-rich environment that supports popular web technologies like JavaScript, HTML, CSS, and Node.js. WebStorm helps you write cleaner, more efficient code with features like syntax highlighting, auto-completion, code refactoring, and built-in testing tools. It integrates with various web frameworks and libraries, making it a versatile choice for both front-end and back-end development.
The latest WebStorm update has introduced support for signal queries added in Angular 17.2. This update brings more accurate type inference and better code completion when working with signal-based expressions. It also improves navigation between signals and their references, making it easier for developers to trace and manage reactive dependencies in Angular applications.
WebStorm is licensed per user, and is available as a commercial annual subscription license. We can supply new subscriptions, subscription renewals, lapsed renewals, and additional user licenses. See our WebStorm licensing page for full details.
WebStorm is available to buy in the following products:
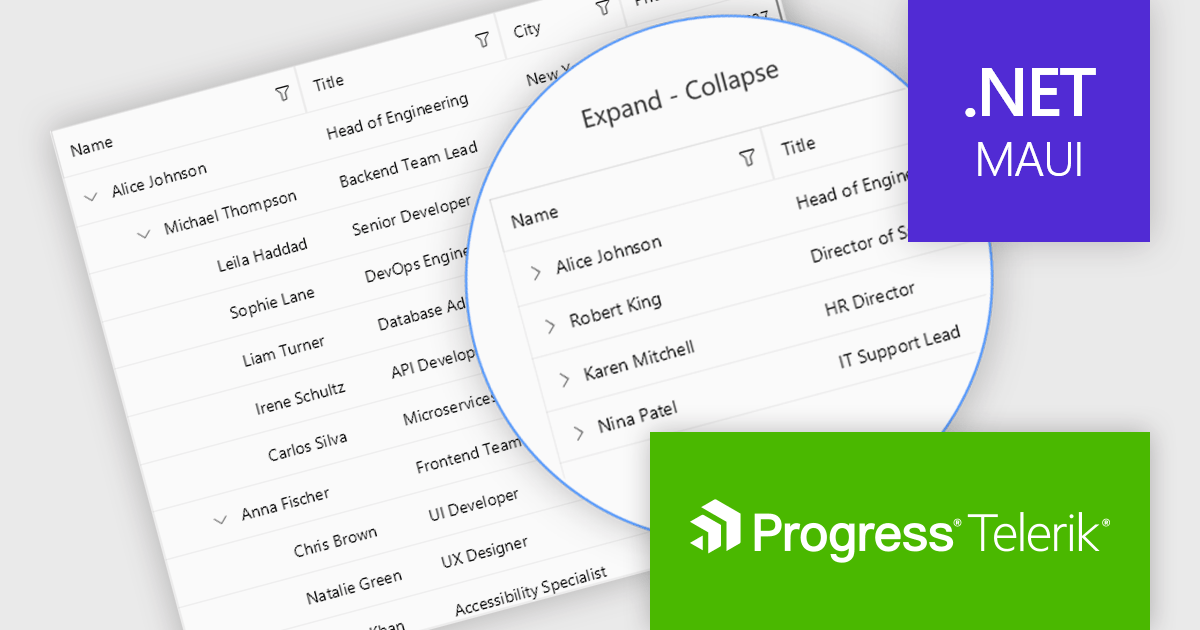
Telerik UI for .NET MAUI is a robust suite of user interface components designed to simplify the creation of cross-platform applications using .NET Multi-platform App UI (MAUI). It offers a wide range of pre-built controls, including charts, grids, and navigation elements, enabling developers to build visually appealing, high-performance apps for Android, iOS, Windows, and macOS from a shared codebase. By ensuring a consistent user experience across platforms, it accelerates development and allows a focus on functionality, making it ideal for business applications, dashboards, and data-driven projects.
The Telerik UI for .NET MAUI 2025 Q2 update introduces the TreeDataGrid component, providing users with a powerful tool for presenting complex, hierarchical data in a structured, grid-based layout. By combining the features of a TreeView and a DataGrid, the TreeDataGrid enables efficient display and interaction with nested data using multiple columns, expandable rows, and customizable indentation. It supports dynamic operations such as adding or removing child items, auto-expanding nodes, and conditionally rendering expandable sections, providing precise control over data presentation and user experience.
To see a full list of what's new in 2025 Q2 (v11.0.0), see our release notes.
Telerik UI for .NET MAUI is licensed per developer and has two licensing models: an annual Subscription License and a Perpetual License. The Subscription license provides access to the latest product updates, technical support, and exclusive benefits for a flat annual fee, and must be renewed to continue using the software. The Perpetual license is a one-time purchase granting access to the current released version and includes a one-year subscription for product updates and technical support. After this initial period, users can choose to renew the subscription element to continue receiving updates and support; otherwise, they may continue using the installed version available during their active subscription term but will forgo future updates and support. See our Telerik UI for .NET MAUI licensing page for full details.
Telerik UI for .NET MAUI is available individually or as part of the following products:
聯繫電話: (888) 850 9911
傳真: +1 770 250 6199


