


官方供應商
我們作為官方授權經銷商,直接提供超過200家開發廠家所發行超過1000個的產品授權給您。
請參閱我們所有的品牌。
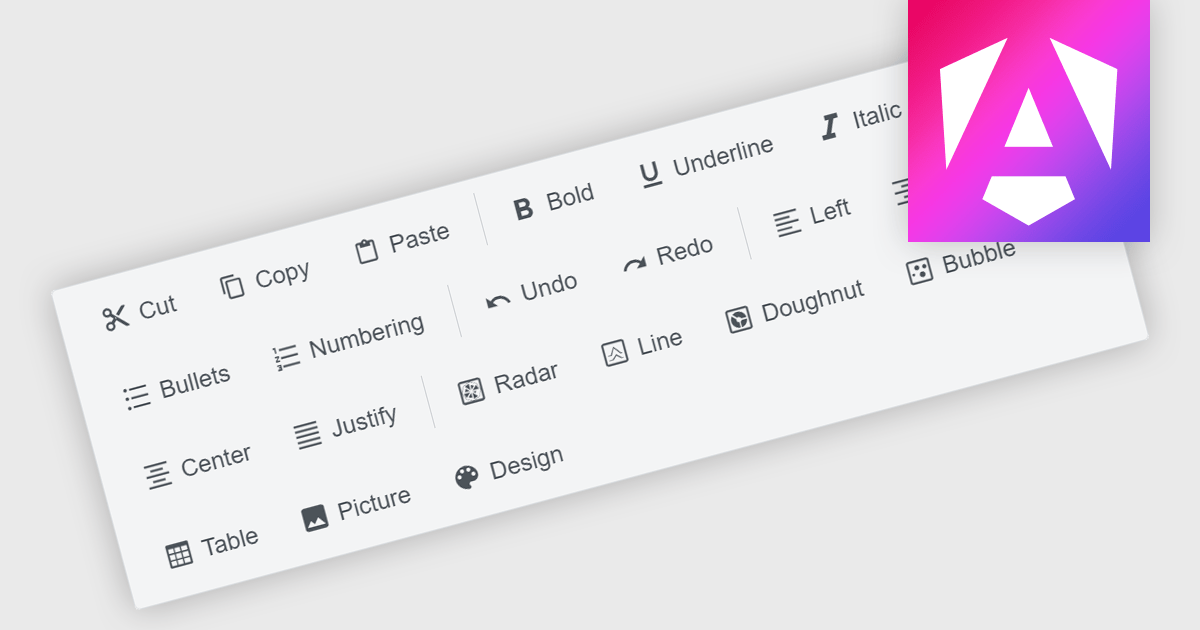
Toolbar components are a common feature in modern Angular UI suites, providing a structured way to present frequently used commands within an application. Typically displayed as a horizontal or vertical strip of buttons, icons, and interactive controls, a toolbar helps developers organize actions in a clear and accessible location. In Angular-based applications, toolbar components are often designed to work with the framework's component architecture, supporting features such as templating, responsive layouts, and integration with other UI elements like menus, dropdowns, and input controls. This allows developers to build consistent command surfaces while maintaining flexibility in how functionality is exposed to users.
Several Angular UI suites offer toolbar components including:
For an in-depth analysis of features and price, visit our Angular UI suites comparison.
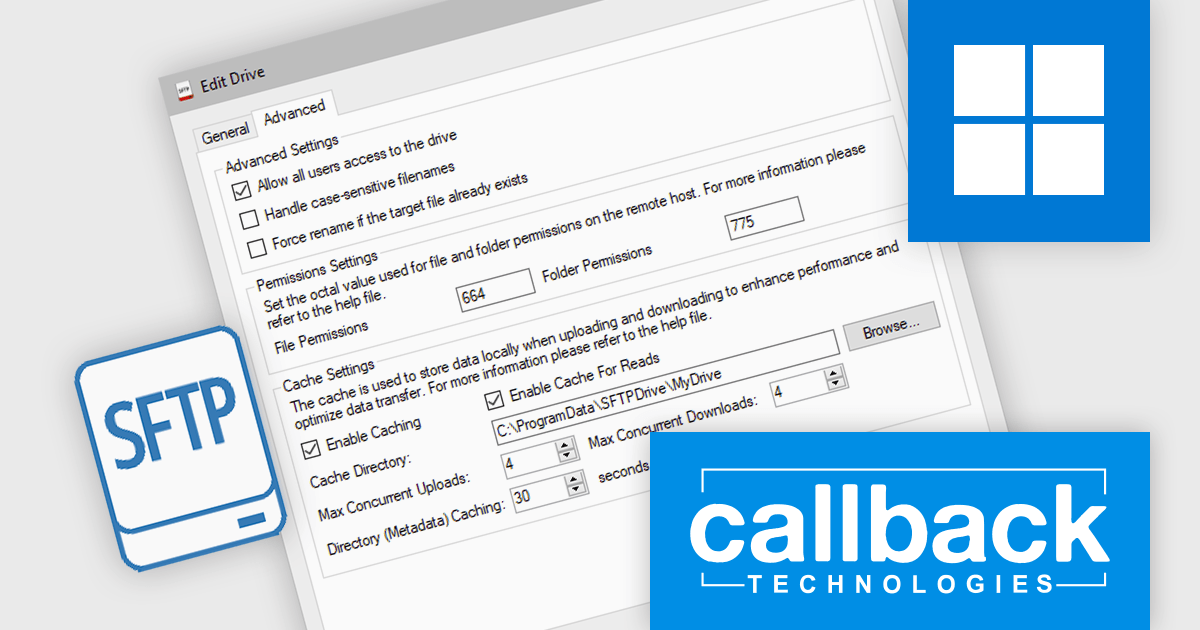
SFTP Drive from Callback Technologies allows you to map remote SFTP servers as local drives on your Windows system. By assigning a drive letter (e.g., "S:" or "Z:") to your SFTP server, you can read, write, and modify remote files directly from Windows Explorer or any application as if they were on your local machine. This integration preserves directory structures and requires no changes to your existing applications.
Callback Technologies SFTP Drive improves file transfer performance by using intelligent caching to temporarily store file content and metadata locally before transmitting it to the SFTP server. This reduces the number of network round trips required for file system operations, allowing the drive to consolidate write activity and upload complete files more efficiently. As a result, applications interacting with the virtual drive experience faster responsiveness and more consistent behavior, even when files are written in multiple steps or through frequent small I/O operations.
Callback Technologies SFTP Drive is licensed per user or per server and is available with one year of free upgrades and priority support. See our Callback Technologies SFTP Drive licensing page for full details.
For more information, visit our Callback Technologies SFTP Drive product page.
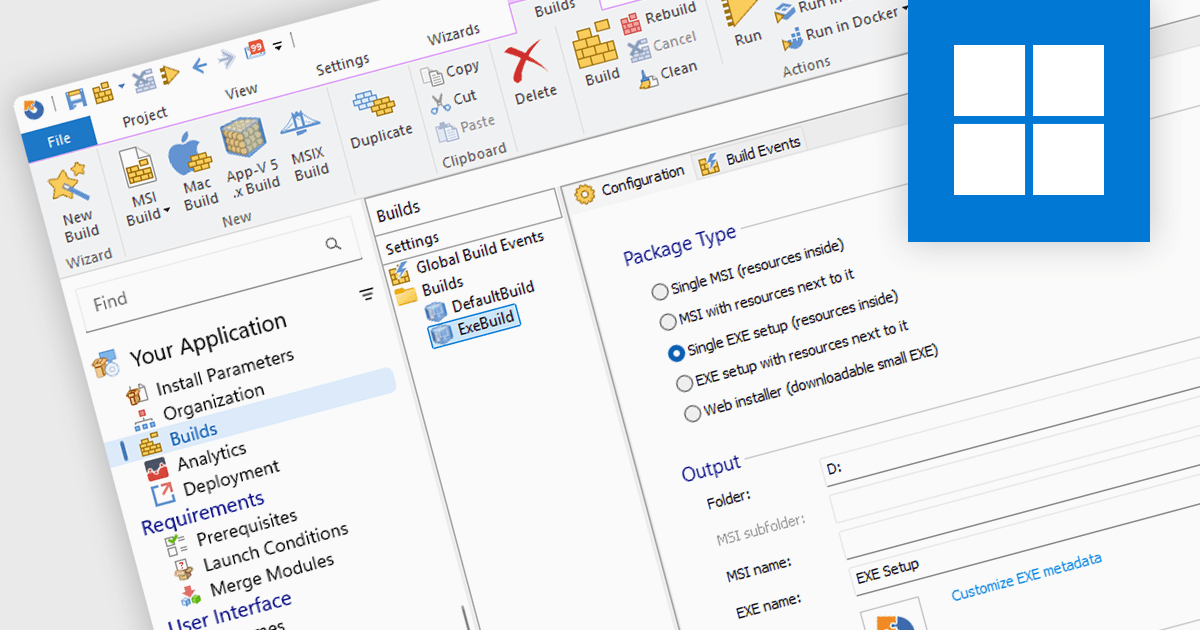
Installation tools are professional software solutions used to create, configure, and deliver application setup packages in a controlled and repeatable manner. They extend far beyond simply copying files, managing dependencies, system configuration changes, environment variables, registry updates, and prerequisite validation to ensure applications function correctly after deployment.
Used by independent software vendors distributing commercial products as well as enterprise IT teams preparing internal applications, these tools provide a structured framework for building installers that align with operating system standards and organizational policies. By formalizing the installation process, they reduce deployment errors, support versioning strategies, and maintain consistency across development, testing, and production environments.
Modern installer authoring tools typically offer graphical environments for building Windows-based formats such as MSI, EXE, and increasingly MSIX. Common capabilities include customizing installer processes and user interfaces, managing prerequisites and bundled components, digitally signing packages, and validating installations prior to release. Many solutions also support application repackaging, compatibility testing, virtualization formats, and integration with development pipelines or endpoint management systems — reflecting the needs of both software publishers and enterprise administrators.
Several installation tools offer these features including:
For an in-depth analysis of features and price, visit our comparison of Installation Tools.
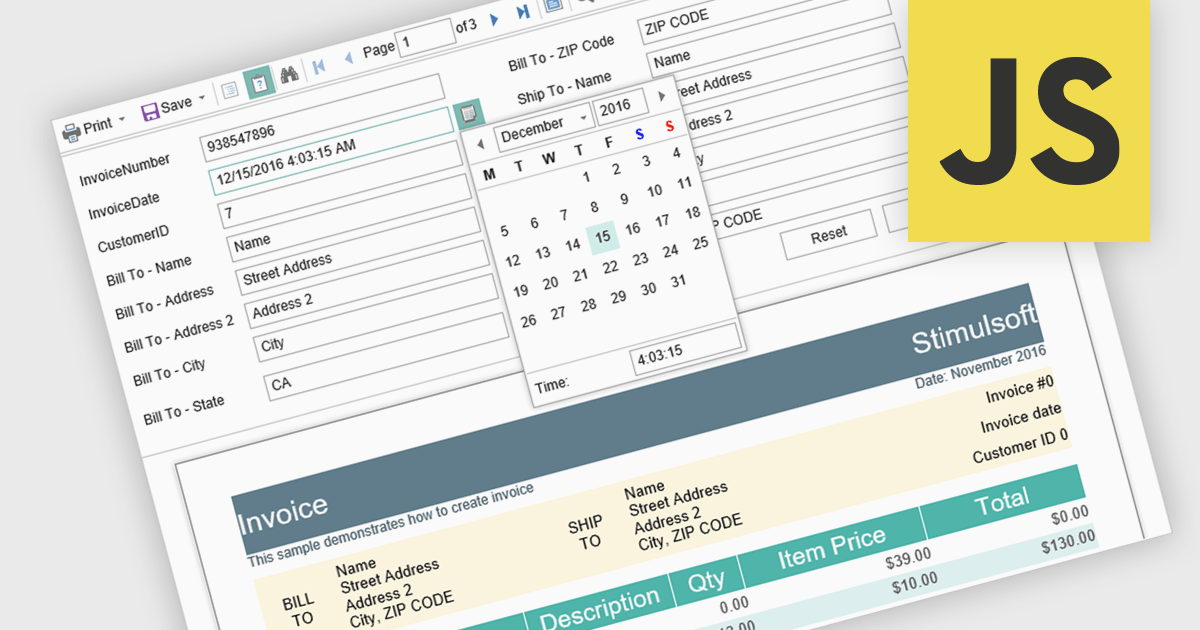
Parameter support in a reporting component refers to the ability to define input variables that control how a report is generated at runtime. These parameters can be used to filter data, adjust date ranges, select categories, or toggle specific report options without modifying the underlying report design or query logic. For software developers, this capability enables the creation of reusable and adaptable reports that respond dynamically to user input or application context. It improves maintainability by separating report structure from variable inputs, reduces duplication by allowing a single report definition to serve multiple scenarios, and enhances integration with applications by supporting programmatic parameter binding through application programming interfaces (APIs).
Several JavaScript reporting components support report parameters including:
For an in-depth analysis of features and price, visit our JavaScript reporting comparison.
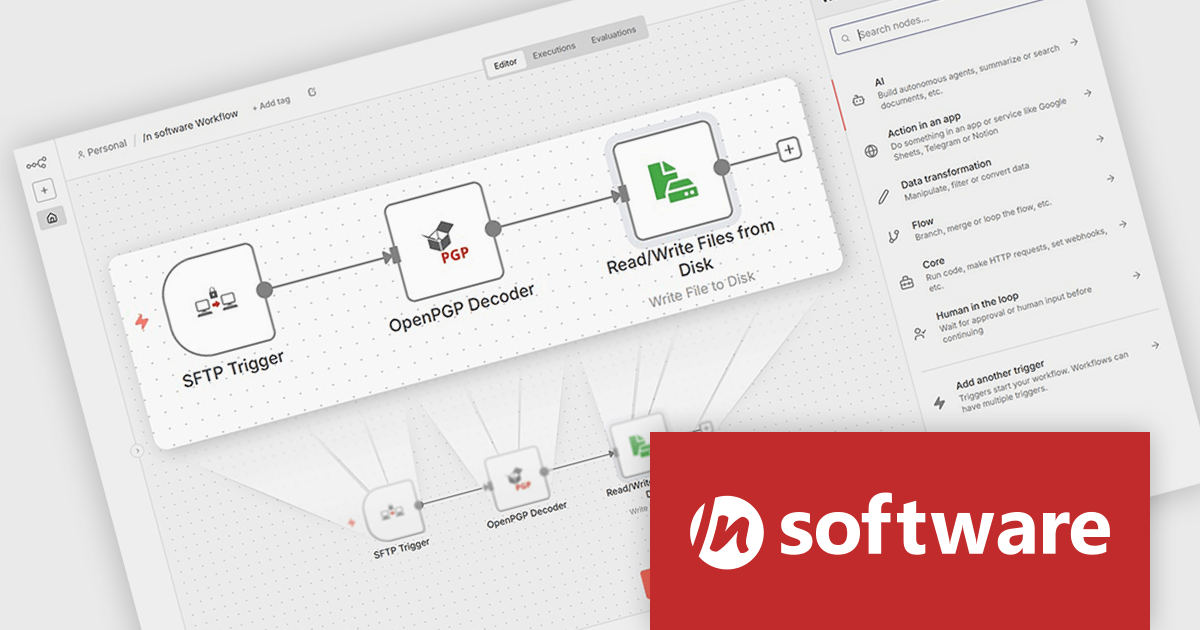
/n software n8n Nodes (included in Red Carpet Subscription) extend the n8n workflow automation platform with specialized capabilities for secure communications, data transfer, and cryptographic processing. These nodes introduce functionality that goes beyond the standard integrations available in n8n, enabling workflows to securely exchange data with external systems using established Internet protocols and security standards. This allows developers to incorporate encryption, digital signatures, secure messaging, and managed file transfers directly into automated workflows without relying on external tools or custom-built components.
Designed to integrate with the n8n editor, the nodes install as native components and can be used alongside built-in or community nodes within the same workflow. Once installed, developers can incorporate secure email processing, OpenPGP encryption and decryption, and secure file transfer operations as standard workflow steps. By providing lower-level cryptographic control and secure file-handling capabilities, the /n software n8n Nodes enable organizations to automate processes that involve sensitive or regulated data while maintaining strong security practices and reliable system integration.
To see a full list of what's new in Red Carpet Subscription Vol. 1 2026, see our release notes.
n8n Nodes is available as part of Red Carpet Subscription which is licensed per developer and is available as a Perpetual License with a 12 month support and maintenance subscription. See our Red Carpet Subscription licensing page for full details.
For more information, visit our /n software Red Carpet Subscription product page.
聯繫電話: (888) 850 9911
傳真: +1 770 250 6199


