


官方供應商
我們作為官方授權經銷商,直接提供超過200家開發廠家所發行超過1000個的產品授權給您。
請參閱我們所有的品牌。
Stimulsoft Ultimate is a reporting and dashboard solution that provides a set of tools for building interactive reports and data visualizations across platforms, including WinForms, ASP.NET, .NET Core, Blazor, JavaScript, WPF, PHP, Java, and Avalonia. It enables developers and organizations to design, generate, and deploy professional reports and dashboards using visual designers, flexible styling options, rich charting and data visualization components, and extensive data connectivity. With support for multiple development environments and technologies, Stimulsoft Ultimate helps teams improve report creation, maintain consistent designs, and deliver clear, data-driven insights for business intelligence, analytics, operational reporting, and enterprise applications.
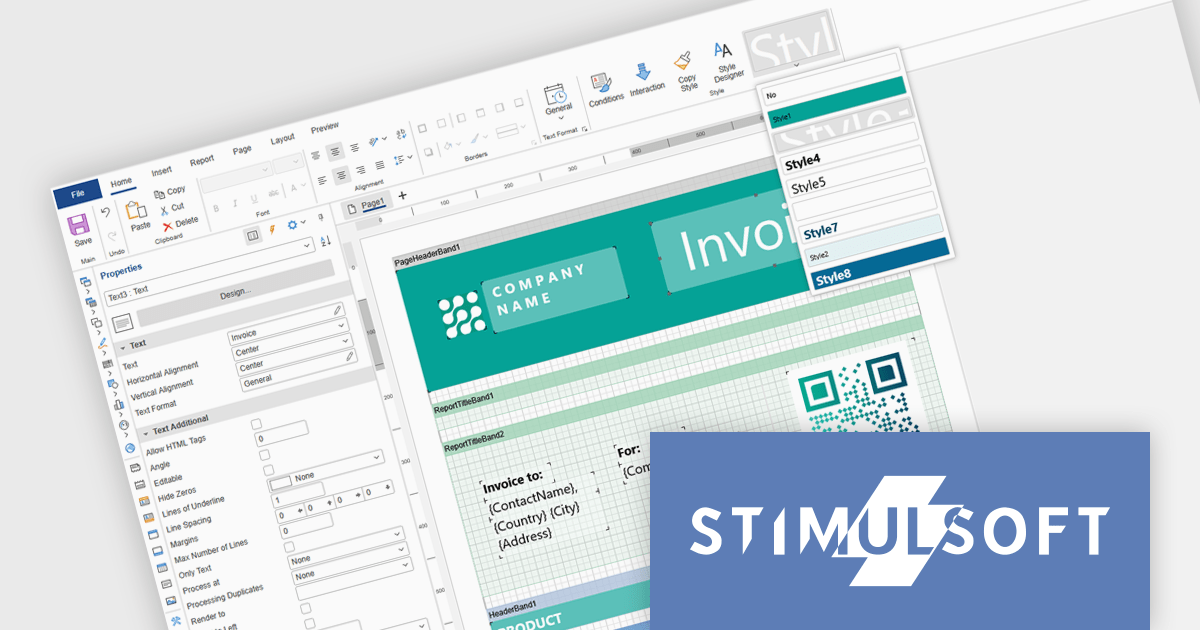
Stimulsoft Ultimate enables developers to apply centralized report styling that ensures consistent formatting across report elements while reducing the time required to design and maintain reports. By using reusable styles for fonts, colors, borders, and other visual properties, developers can standardize report layouts, quickly apply formatting to multiple components, and implement global design changes without editing each element individually. This approach improves development efficiency, simplifies maintenance, and helps teams deliver professional, visually consistent reports across applications and platforms.
Stimulsoft Ultimate is licensed per developer with Single, Team, Enterprise, and WorldWide options that support one to unlimited developers within an organization. Licenses include a 12 month subscription with updates, priority technical support, a royalty free runtime report designer and viewer, and a build server license for Team and higher tiers. See our Stimulsoft Ultimate licensing page for full details.
For more information, visit our Stimulsoft Ultimate product page.
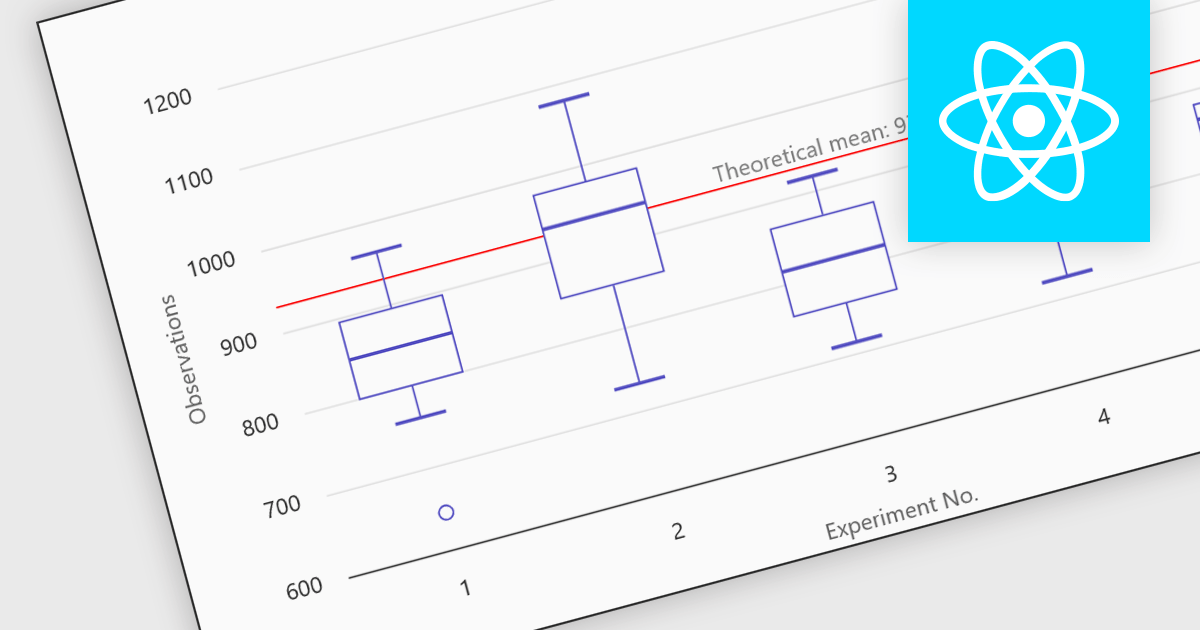
Box plots in React chart controls are statistical visualizations used to present the distribution of a dataset by highlighting key summary values, including the minimum, first quartile (Q1), median, third quartile (Q3), and maximum. In React applications, chart components render this information as a rectangular box representing the interquartile range, with lines known as whiskers extending to the minimum and maximum values, and optional markers indicating outliers. This visualization allows developers and analysts to quickly understand data spread, central tendency, and variability within a dataset. Box plots are commonly used in analytical dashboards, financial analysis tools, and scientific applications built with React, where comparing distributions and identifying anomalies across multiple data groups is important.
Many React chart controls support box plots including:
For an in-depth analysis of features and price, visit our comparison of React chart controls.
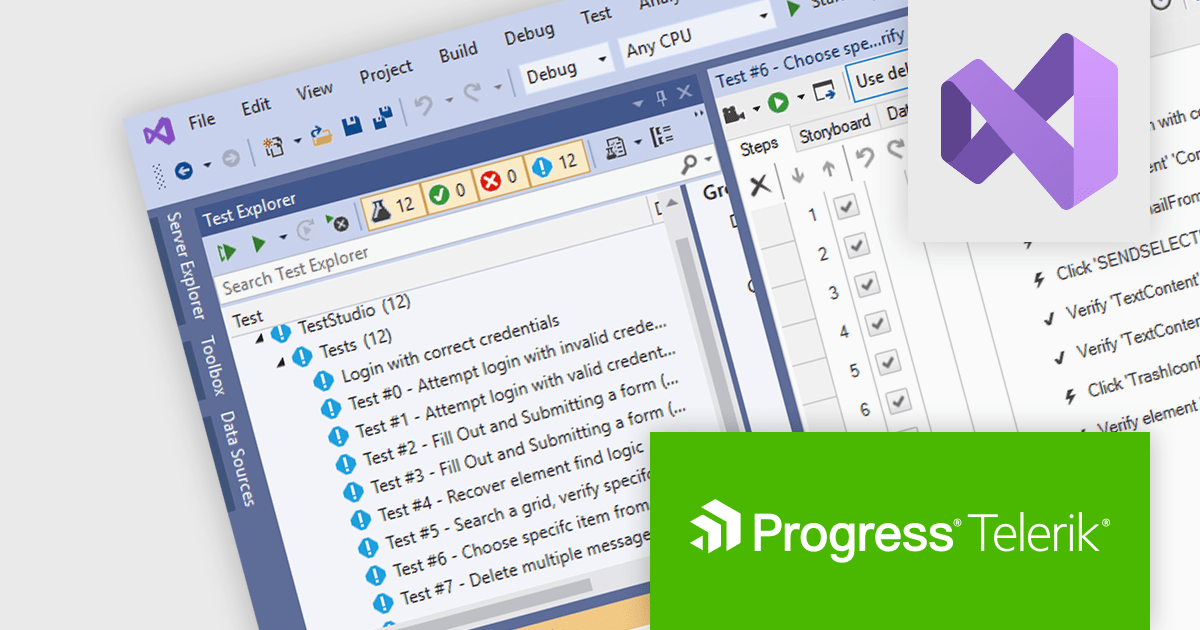
Telerik Test Studio is an automated testing platform that enables development and QA teams to create, manage, and execute tests for web, desktop, and responsive applications, supporting functional user interface (UI), load and performance, and RESTful application programming interface (API) testing through both visual test recording and code-based automation, while integrating with tools such as Microsoft Visual Studio and continuous integration pipelines to help ensure application quality throughout the software development lifecycle.
The Telerik Test Studio 2026 Q1 update adds support for Microsoft Visual Studio 2026 allowing developers and QA teams to create, manage, and execute automated tests directly within the latest version of Microsoft’s integrated development environment (IDE). This compatibility ensures that teams adopting Visual Studio 2026 can continue using Test Studio without disruptions, while benefiting from the IDE's modern tooling, improved performance, and updated platform integrations. By aligning with the newest Visual Studio environment, Test Studio enables testers to maintain a consistent development and testing pipeline, integrate automated tests more easily into existing projects, and take advantage of the latest capabilities in the Visual Studio ecosystem for building and maintaining reliable test automation.
To see a full list of what's new in 2026 Q1, see our release notes.
Test Studio is licensed per machine using a floating user license that allows activation on one machine at a time, with one user able to build, modify, and execute tests on the licensed machine. Each license includes a one year maintenance subscription with priority support. See our Telerik Test Studio licensing page for full details.
Test Studio is available in two editions, learn more on our product pages:

Allround Automations develops powerful tools designed to simplify Oracle database development, administration, and maintenance. Their products help developers write, test, debug, and optimize PL/SQL code more efficiently, while providing intuitive interfaces and productivity features that improve everyday database development tasks.
Their flagship product, PL/SQL Developer, is a comprehensive IDE designed to simplify the development, debugging, and optimization of Oracle PL/SQL program units.
Through this long standing partnership, ComponentSource is able to expand its specialized database development portfolio and offer Allround Automations tools to customers around the world. By providing global sales, licensing, and support services, ComponentSource helps ensure developers everywhere can access and adopt these Oracle development solutions.
Learn more about Allround Automations.
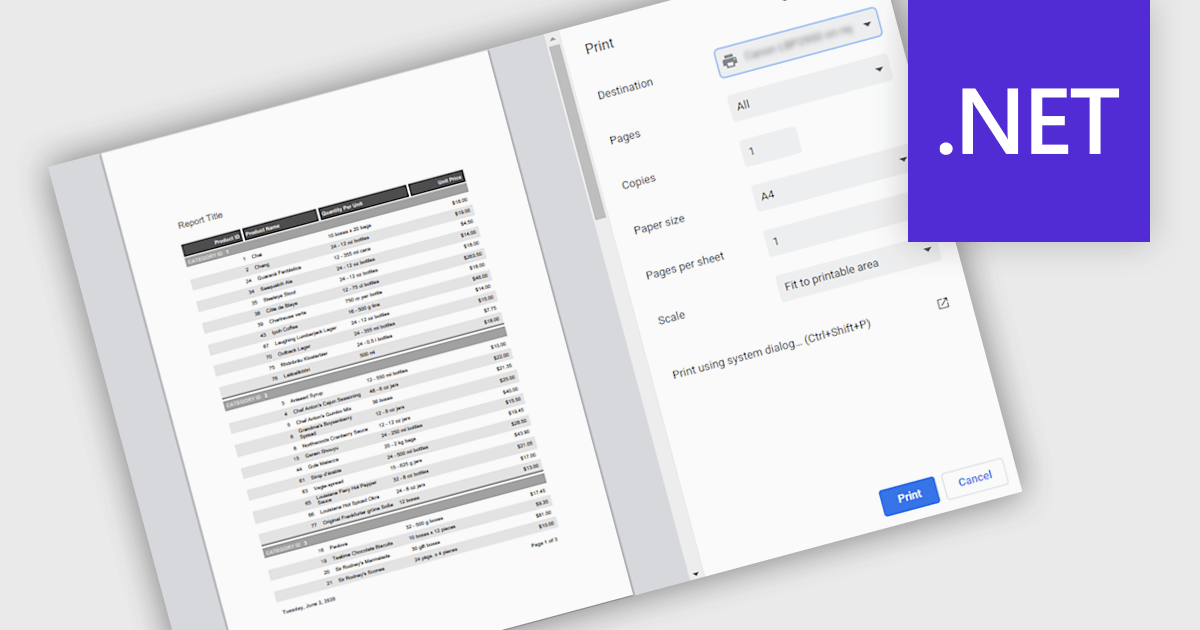
Printing reports allows users to generate physical copies of structured data, summaries, or analysis directly from an application. By converting digital information into printed documents, users can easily review content offline, share insights in meetings, and maintain clear records for documentation or compliance. Printed reports provide a consistent layout that improves readability and makes complex information easier to present to stakeholders who may prefer or require hard copies. Common use cases include distributing reports during team meetings, preparing documentation for audits or regulatory requirements, archiving important records, and sharing key findings with clients or decision-makers in a clear and professional format.
Several .NET reporting components support printing including:
For an in-depth analysis of features and price, visit our .NET reporting comparison.
聯繫電話: (888) 850 9911
傳真: +1 770 250 6199


