


官方供應商
我們作為官方授權經銷商,直接提供超過200家開發廠家所發行超過1000個的產品授權給您。
請參閱我們所有的品牌。

Data dissemination often requires flexibility and accessibility. Exporting reports to DOCX format serves this need by seamlessly translating the insights gleaned from your report into a familiar, editable document. This format preserves the structural integrity and visual aesthetic of your report while leveraging the ubiquitous editing capabilities of Microsoft Word. This dual benefit makes DOCX export ideal for several scenarios: disseminating reports to diverse audiences, seamlessly integrating reports into larger documents, and ensuring both data clarity and professional presentation. It essentially establishes a bridge between the structure of reporting tools and the adaptable environment of Word documents, empowering you to share your findings with maximum impact and ease.
Several ASP.NET Core reporting components allow you to export to DOCX format, including:
For an in-depth analysis of features and price, visit our comparison of ASP.NET Core reporting controls.

Data filtering and grouping are key spreadsheet features that allow users to manage and analyze large datasets efficiently. Filtering enables users to hide data that does not meet certain criteria, making it easier to focus on relevant information. Grouping clusters related data together, which can then be summarized with functions such as sum, average, and count. These features are vital for working with extensive spreadsheets, enabling users to simplify their view, and gain insights from specific subsets of data.
Several Angular Spreadsheet components provide data filtering and grouping support including:
For an in-depth analysis of features and price, visit our Angular Spreadsheet Component comparison.
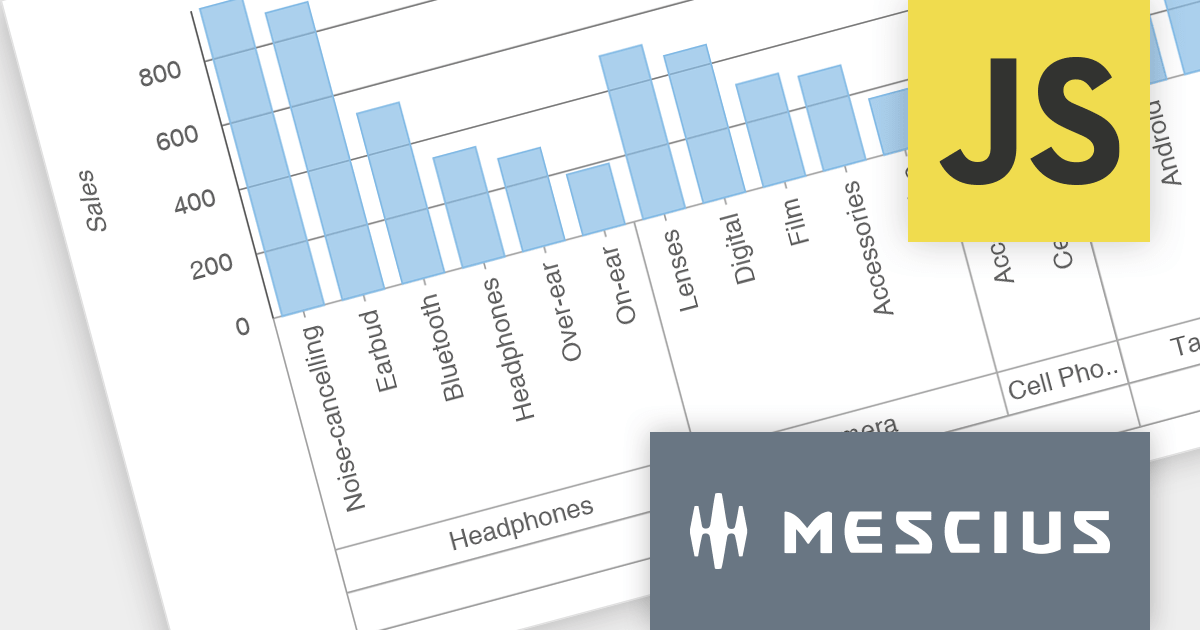
Wijmo is a cross-platform UI JavaScript library that offers a comprehensive set of controls and tools for building rich, interactive web applications. Its components have zero dependencies and are written as lean TypeScript classes. Wijmo's key components include FlexGrid for data management, FlexChart for charting and data visualization, Input Controls for user input, and Report Viewer for creating and presenting reports.
The Wijmo 2023 v2 release brings data grouping support to FlexChart. Axis grouping helps to organize complex data by visually separating it into categories or subcategories along the axis, making it easier to identify trends, patterns, and outliers within each group. While data grouping has long been a staple of Wijmo's CollectionView, users requested similar functionality in FlexChart, which MESCIUS has now incorporated. You can bind FlexChart to a grouped CollectionView and set the 'axis.groupsOptions' property to enable grouped labels in your charts.
To see a full list of what's new in version 2023 v2, see our release notes.
Wijmo is licensed per developer. Developer Licenses are perpetual and include 1 year Subscription which provides upgrades, including bug fixes and new features. See our Wijmo licensing page for full details.
For more information, visit our Wijmo product page.
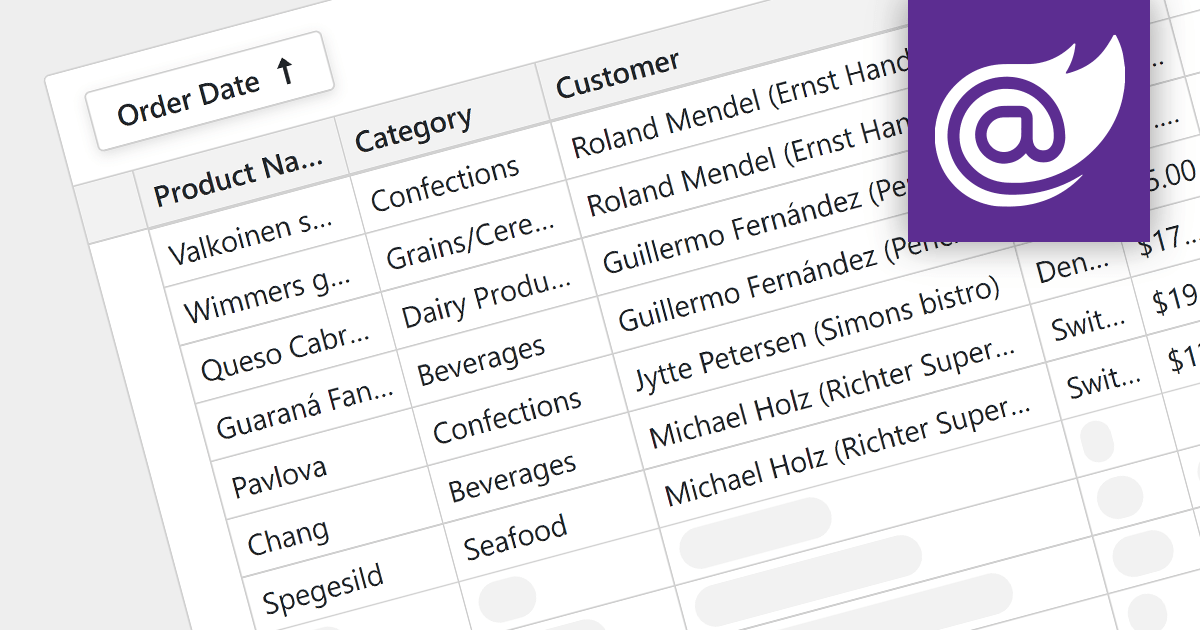
For large datasets, traditional grid scrolling struggles to maintain performance, often becoming sluggish and resource-intensive. Virtual scrolling provides a more efficient alternative. Instead of rendering the entire dataset at once, it dynamically fetches and displays only the visible rows, keeping the rest cached and unloaded. This significantly reduces the number of elements in the application, resulting in a noticeably smoother scrolling experience, even with millions of data points. Virtual scrolling empowers users to seamlessly explore expansive datasets without compromising performance or responsiveness.
Several Blazor grid components support virtual scrolling including:
For an in-depth analysis of features and price, visit our Blazor grids comparison.
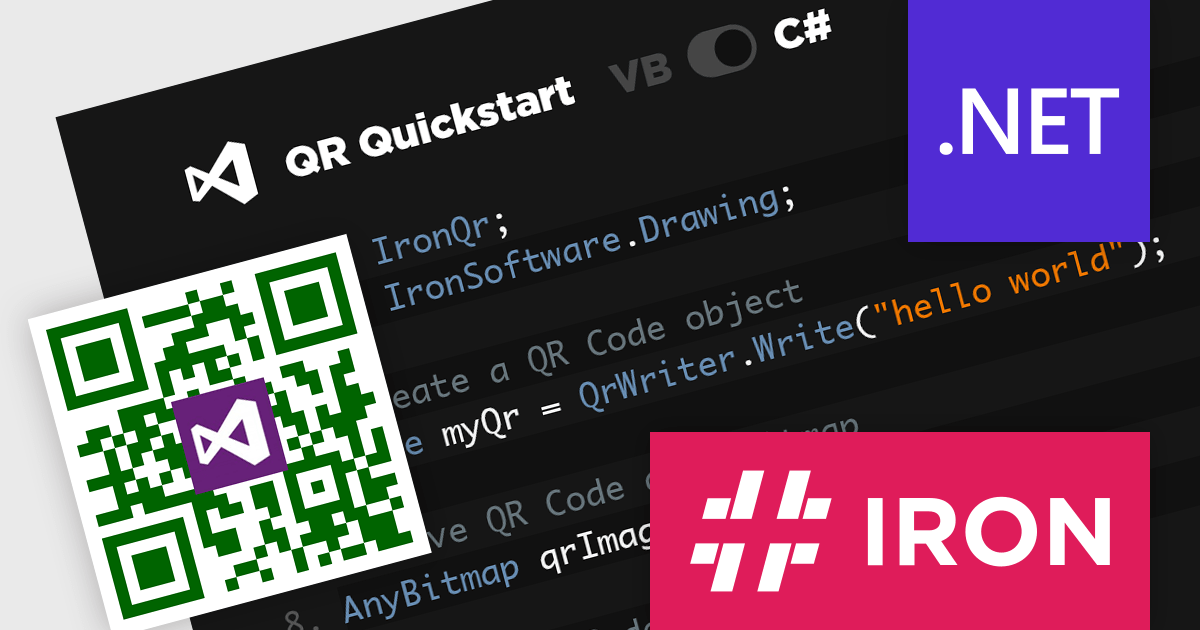
IronQR for .NET by Iron Software is a new C# library specifically designed for .NET developers who want to effortlessly integrate QR code functionality into their applications. Whether you need to generate or read QR codes, IronQR offers a user-friendly API that minimizes coding complexity and streamlines the development process. It offers customization options including the ability to resize, add margins and borders, recolor, and embed logos. Additionally, it provides fault tolerance mechanisms, enabling developers to ensure the reliability of their QR codes by choosing the appropriate QR version, implementing null checking, checksum validation, and error message generation.
IronQR for .NET is licensed per developer and is available as a perpetual license with 1 year of product updates and support services. Lite, Plus and Professional Licenses are available for different development and distribution requirements. See our IronQR for .NET licensing page for full details.
IronQR for .NET is available to buy in the following products:
聯繫電話: (888) 850 9911
傳真: +1 770 250 6199


