
MindFusion.Charting for WebForms
將圖表和儀錶添加到您的 ASP.NET WebForms 應用程式中。
由以下開發商製作:MindFusion Group
ComponentSource 開始代理銷售的日期:2003年
我們已經停止提供這種個產品。
將圖表和儀錶添加到您的 ASP.NET WebForms 應用程式中。
由以下開發商製作:MindFusion Group
ComponentSource 開始代理銷售的日期:2003年

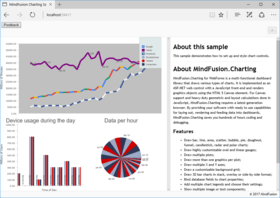
MindFusion.Charting for WebForms is a multi-functional dashboard library that draws various types of charts and gauges. It is implemented as a ASP.NET web control and can easily be integrated with any application targeting the Microsoft ASP.NET platform. By providing your software with ready to use capabilities for laying out, rendering and feeding data into dashboards, MindFusion.Charting for WebForms saves you hundreds of hours coding and debugging.

MindFusion.Charting for WebForms Features
Live Chat現在與我們的MindFusion Group 專家即時聊天詢問。


聯繫電話: (888) 850 9911
傳真: +1 770 250 6199


