
SharePoint Business Charts
在 SharePoint 中創建圖表。
由以下開發商製作:BoostSolutions
ComponentSource 開始代理銷售的日期:2009年

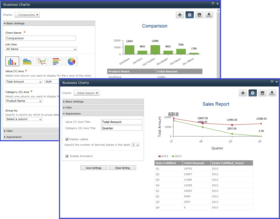
SharePoint Business Charts provides an easy way for end users to create charts directly in a SharePoint list without help from an IT administrator. End users just click the ribbon button to get started. Business Charts has an intuitive and simple-to-use interface which drive users to finish settings themselves, reducing an administrator’s workload.

Multiple Chart Types Supported
5 chart types are provided in Business Charts: Bar, Column (Stacked Bar), Line, Area and Pie. Users can pick which type of chart they want to use and can change between chart types. Even Better, Business Charts allows users to create multiple charts in one list or Web Part, which improves users analysis.
Supports Aggregate Functions to Analyze Data
When users create a chart, they can use several functions (SUM, COUNT, AVERAGE, MAX, MIN, etc.) to sort or summarize...

SharePoint Business Charts 也以___提供︰
Live Chat現在與我們的BoostSolutions 專家即時聊天詢問。


聯繫電話: (888) 850 9911
傳真: +1 770 250 6199


