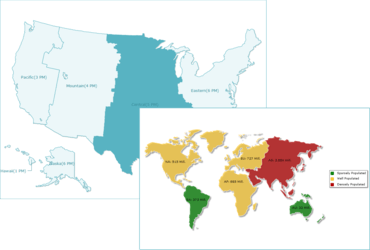
Includes updates to the core maps package.
July 19, 2016
New Version
Features
- Core maps package updated for the following:
- Added specification sheets for six Lebanon Governorates under Lebanon (Governorates).
- Added specification sheets for 16 Kazakhstan state maps under Kazakhstan (Regions).
- Updated the specification sheet for Madhya Pradesh to:
- add the Anuppur, Singrauli, Alirajpur, and Burhanpur districts.
- rename Narsimphapur to Narsinghpur, East Nimar to Khandwa, and West Nimar to Khargone.
- Updated the specification sheet for Rajasthan to:
- add the Pratapgarh district.
- rename Ganganagar to Sri Ganganagar and Jalor to Jalore.
- Updated the specification sheet for Punjab to:
- add the Barnala, Fazilka, Sahibzada Ajit Singh Nagar, Pathankot, and Tarn Taran districts.
- rename Muktsar to Sri Muktsar Sahib and Nawanshar to Shahid Bhagat Singh Nagar.
- Updated the specification sheet for Netherlands to change short labels for Gelderland, Limburg, NoordBrabant, Zeeland, and ZuidHolland.
- Updated the specification sheet for East Timor to rename Ambeno to Oecusse.
- New toolbar introduced to manage the UI action elements (context menus, checkboes, buttons) centrally.
- Chart data can now be exported to XLS.
- Batch export allows multiple charts on the same page to be exported as a single JPG/PNG image.
- Legend sliders are now hidden when the gradient legend is disabled in charts and maps.
- New attributes added to control border color and opacity.
Fixes
- Change in font size and font family, when a chart is exported as SVG, has now been corrected.
- Runtime error generated when the legendItemClicked event is triggered has been fixed.
- Rendering very small data values no longer causes the browser to crash or become unresponsive.
- The anchorHoverEffect attribute is now working as expected. Previously this attribute affected all data plots (and not just anchors) and worked even when showHoverEffect=0. The attribute has now been fixed to affect only the anchor data plots and work only when showHoverEffect=1.
- The horizontal scroll bar that appeared on the webpage when the HTML tag dir is set to rtl has now been removed.
- In Google Chrome, the no data to display error encountered upon the inclusion of theme in charts has been fixed.
- Tooltip rendering issues in touch devices, particularly prominent in Android devices, have been fixed. On touch devices, tooltips are shown when a data plot is tapped on
- Category labels in the chart data are now rendered correctly irrespective of the number of labels and the chart size.
Display geographical data like revenue by regions, election results and office locations effectively using interactive maps.
Got a Question?
Live Chat with our FusionCharts licensing specialists now.

Official Distributor since 2020
