SQL Diagnostic Manager 10.2.1

Adds SDM 10.2 capabilities to the browser interface in IDERA Dashboard.
September 20, 2017
New Version

Features

This release adds the capability previously added in SQL Diagnostic Manager (SDM) 10.2 to the browser interface in IDERA Dashboard.

  • Time-based drilldown in SQL Diagnostic Manager.  Select any time range on any graph to zoom in for more detail and isolate that time range as you navigate to other graphs.
  • History Range Control.  Choose the range being displayed with a common control to specify start date and time and end date and time or select the most recent history.
  • Performance Improvements.  Extensive scalability and user productivity improvements.

In addition, a new configurable instance overview summary page with direct drilldown to more detail has been added.
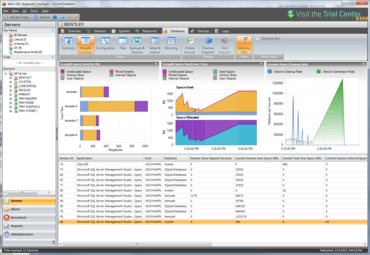
  • SDM Pro Instance Overview - Combined information from various components of SDM and SQL Workload Analysis in a single overview with launch points to the respective components.
    • Alert and Health Summary – High level summary panels with drilldown to alert details.
    • Prescriptive Analysis Summary – Recommendations by category with drilldown.
    • Alert Timeline - Broken down to alert categories and configurable.
    • SQL Workload Timeline - Based on aggregate query waits performance.
    • Configurable Instance Summary Graphs - Select which instance summary graphs to display and how they are ordered.  Vertically aligned to time correlate multiple performance metrics.
SQL Diagnostic Manager

SQL Diagnostic Manager for SQL Server

24x7 SQL performance monitoring, alerting and diagnostics.

Got a Question?

Live Chat with our IDERA licensing specialists now.