Official Supplier
As official and authorized distributors, we supply you with legitimate licenses directly from 200+ software publishers.
See all our Brands.

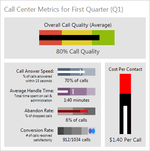
Screenshots: A bullet graph is a special kind of bar chart used to display a single value in a context of one or more related values. ...

Description: and quartiles. Bullet graphs that render a measure within the context of other measures. Candlestick charts that show price movements over time. Heat maps, with marker color and/or size changing features. Segment ... Small charts, also called sparklines, designed to visualize complex data. Actipro Micro Charts for Silverlight visualize quantitative data and are designed to render clearly in compact spaces. Many ... chart types are supported, from basic line and bar charts to stacked area charts. The chart control includes numerous useful features such as multiple series, stacking, hot tracking, customizable palettes ...
Release Notes: Fixed a bug where using aggregation with certain data point types like UInt32 could trigger an exception. ...

Screenshots: A segment chart provides a visual representation of an integer value in relation to a total number. Each segment in the chart is rendered as highlighted or unhighlighted. For instance, if the value ...
Licensing: ...
Pricing: ...
Compatibility: Operating System for Deployment Windows 10 Windows 8.1 Windows 8 Windows 7 Windows Vista Architecture of Product 32Bit Product Type Component Component Type Silverlight Source Code Compatible Containers Microsoft Visual Studio 2015 Silverlight 5+ ...

Screenshots: A heat map is a type of chart that displays a data value matrix represented through markers of varying colors and/or sizes. The gradient used to determine the color to render for any given value ...

Screenshots: A box plot visualizes key statistical measures for a data set, such as the median, mean and quartile values. ...