Official Supplier
As official and authorized distributors, we supply you with legitimate licenses directly from 200+ software publishers.
See all our Brands.
Release Notes: contour generation. Grid Surface Improvements Added support for conversion of triangulated to grid data (binning) using the grid surface data InitFromPoints method. Pie Series Improvements Added property ... with smaller data size as larger on bubbles on the screen and vice versa. Heat Map Series Improvements Added property InterpolateImageEdges to control the way heat maps scale to the edge. Improved heat map ...
Release Notes: Added support for Microsoft.NET Core 8.0- This version adds support for.NET Core 8.0 for the WinForms and WPF chart controls included in the suite. Added a new Cartesian and Pie Charts Data Labels ... Layout- This version includes a new implementation of the data labels layout for improved readability of charts containing many overlapping data labels. The new data labels layout applies to Cartesian ...
Release Notes: Includes three new series (Bar, Line, and Point) that allow you to display extensive data sets (millions of data points) in real-time. Added support for Microsoft.NET Core 7.0- This new version ... that allow you to display extensive data sets (millions of data points) in real-time. The new series utilizes the GPU to perform most of the calculations. All fast series are available in both 2D and 3D. Bug ...
Release Notes: Added support for Microsoft.NET Core 6.0- This release supports.NET Core 6.0 for the WinForms and WPF Chart controls. Bug fixes for all reported problems as well as other performance improvements in the control. ...

Description: or presentation charting enabled applications or even full featured, integrated BI solutions Nevron Chart will deliver data visualization to your WinForm or WebForm applications. Nevron Chart for.NET features: ... of Gauges and KPIs. Advanced chart axes model- categorical, linear, logarithmic, date time, timeline axes. Built-in financial and statistical functions. Non overlapping data and axis labels. Resizable chart ... layout support with docking, anchoring, percentages etc. Data Binding. Interactivity- data zooming, data panning, axis scrolling, tooltips, hit testing etc. Export to PNG, JPG, BMP, GIF, TIFF, SVG, EMF, ...
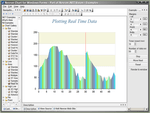
Screenshots: ...
Release Notes: Improves Heat Map labeling and contour generation. Added support for Microsoft.NET Core 5.0- This release supports.NET Core 5.0 for the WinForms and WPF Chart controls. Added support for Microsoft Visual Studio 2022- This new version is distributed with a single installation that can deploy the ...
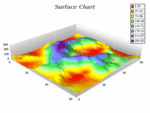
Release Notes: Improves Axes and Triangulated Heat Map Series performance. New and Improved Installer- The new version is distributed as a single installation that can deploy the controls to all versions of Microsoft Visual Studio from 2010. This includes VS2010, VS2013, VS2015, VS2017 and VS2019. Prior versions ...
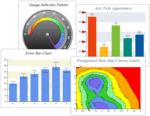
Release Notes: Adds new Triangulated Heat Map series, plus improved features for Vector, Bubble, Bar, Area and Pie Series charts. Triangulated Heat Map Series The Triangulated Heat Map Series adds support for drawing triangulated meshes of arbitrary XYZ points. The X/Y coordinates of the point are used to ...
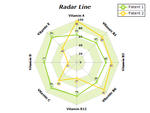
Screenshots: Radar Series, used to create a Radar Chart (Spider Chart, Star Chart), is rendered to a circular graph and is used primarily as a multi-parameter data comparison tool. ...
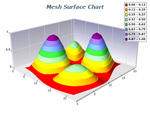
Screenshots: The Mesh Surface chart displays a surface with user-defined y-position, x-position and z-position values for each data point, in contrast to Grid Surface where only y-position (elevation) is user ... defined. Data points are ordered in a regular network. ...
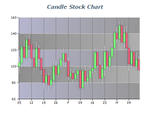
Screenshots: Candle charts are used to plot daily stock data. Each data point resembles a candle, where the candle body is formed by the open and close prices for the day. The high and low prices are displayed ...

Screenshots: Grid and Toolbar components for WinForms. The grid is data aware and supports true date time editing as well as fill effect, line style and cursor type editing. The most frequently used commands ...
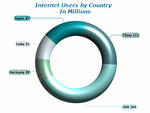
Screenshots: for advertisements and presentations. The data labels are visualized in Spider Mode- aligned in columns on the left and right side of the pie. ...
Features: to your WinForm and ASP.NET application the most advanced data visualization in terms of functionality and looks. Whether you are creating presentational, business, scientific or financial application you ... in different shapes- standard and smooth edge pie, standard, smooth edge or cut edge ring and torus, thus increasing the diversity of chart looks available for advertisements and presentations. The data labels ... for each data point, in contrast to Grid Surface where only y-position (elevation) is user defined. Data points are ordered in a regular network. Candle Stock Chart Candle charts are used to plot daily stock ...
Features: preview support. Built in UI components Grid and Toolbar components for WinForms. The grid is data aware and supports true date time editing as well as fill effect, line style and cursor type editing. ...
Features: desktop or Web-based. It features a complete set of radial and linear gauges, LED displays and state indicators helping you view critical data in real time. Nevron provide support for advanced gauge axes ...
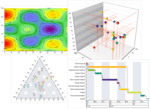
Release Notes: with arbitrary X or Y value. Annotation Drag Tool- The Annotation Drag Tool allows the user to interactively drag annotations attached to different chart anchors (data points, scale coordinates, legend items ...

Features: AJAX Support for Web Forms, server side events (postback) and HTML image maps, ability to inject custom client side script, server side persistency, ability to directly stream an image to the client browser, built-in temporary file clean up and built-in browser detection. ...
Features: Nevron Chart for.NET provides complete set of axis related features designed to target even the most compelling charting requirements. The axes are also largely automatic allowing you to focus on your project and be able to customize every aspect of the appearance and behavior of the axis if needed ...