Official Supplier
As official and authorized distributors, we supply you with legitimate licenses directly from 200+ software publishers.
See all our Brands.

Description: with any server-side technology (ASP.NET, PHP, Python, Java, Ruby on Rails etc.) and database you use. With the extensive documentation and readymade demos it offers, you will need just 15 minutes to create ...
Release Notes: meanValuePosition MDValuePosition SDValuePosition QDValuePosition outlierValuePosition Custom border colors can now be assigned to the icons (for mean, MD, SD, QD, and outlier) using the following attributes: ... In this version, 31 core map files have been updated. Fixes In a box and whisker chart, when hovered over an icon (for mean, MD, SD, QD, or outlier) where meanIconShape, MDIconShape, SDIconShape, QDIconShape, ...
Release Notes: FusionCharts Angular wrapper is now compatible with Angular 8. You can now render charts in angular using angular-fusioncharts wrapper. Previously, the charts were not getting rendered in angular when using angular-fusioncharts wrapper of FusionCharts version 3.14.0. ...
Release Notes: Introduced a new attribute named inheritPlotBorderColor for area charts to set the border color of the plot by inheriting the plot color. You can now customize the position of the x-axis. You can now customize the position of the y-axis. You can now control the visibility of data values by ...
Release Notes: Updates in v3.13.5-sr.1 A minor bug for MSCombiDY2D and MSCombi2D has been fixed. ...
Release Notes: Updates in v3.13.5 Improvement In a multi-level pie chart, 'showLabel' and 'showValue' attributes are now supported at the 'category'level. The file format to export a chart in Excel is now changed from '.xls' to '.xlsx'. Fixes In a multi-series ...
Compatibility: ASP.NET WebForms ASP.NET AJAX (ATLAS).NET Class HTML5 JavaScript Angular AngularJS jQuery React Vue.js Source Code Language English French German Italian Spanish Arabic Chinese Dialect(s) Hebrew Japanese ...
Release Notes: Introduces two new chart types- Overlapped Column Chart and Overlapped Bar Chart. FusionCharts Suite XT v3.13.0 introduces two new chart types: overlapped column chart and overlapped bar chart. Spline and Spline Area charts can now be built as part of combination charts, using the `renderAs` ...
Release Notes: Improved memory consumption for charts that are continuously rendered and disposed. FusionCharts export servers have been reconfigured to introduce the following features: Export charts in auto-export mode- lets users make optimum use of the server-side and client-side export capabilities. Export ...
Release Notes: rendering space available, the tooltip is constrained to fit inside the chart. Trailing commas in the JS code generated by the.NET wrapper have now been removed. FusionCharts Fixes: For the zoomline dual ...
Release Notes: when set to ROTATE. Previously, for `labelDisplay=ROTATE`, labels were not getting displayed. Label positioning issues in pie and doughnut charts have been fixed. Previously, label ... overlapped the caption/subcaption. The JavaScript error in zoomline chart when a chart height was less than 173 has now been fixed. Labels in bubble chart is now displayed as expected without any line break. For ... Previously, this method was escaping characters for encoding. ...
Release Notes: rendered in Firefox, has been fixed. The borderHoverDashed attribute (for column data plots) now works as expected when specified at the dataset level. Rendering issues in the doughnut chart, for zero value ...

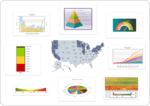
Screenshots: Why use a column chart when a funnel chart is what you need? Incorrect chart types lead to incorrect analysis, which in turn lead to incorrect business decisions. Your users deserve better. FusionCharts Suite XT brings you 90 chart types (total number for suite) right from the basic Column, Line, ...

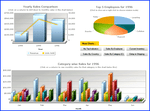
Screenshots: The Charts don't just look good; they feel good too! Fusioncharts are highly interactive with drill-down, tooltips, zooming, panning, chart export and visual editing. Makes for an enjoyable reporting experience. ...

Screenshots: Creating an information portal or business monitoring dashboard? Surely your users would like to export the charts for their presentations or emails. Enable export to JPG, PNG and PDF programmatically, or through user interaction. ...
Release Notes: Updates in v3.10 New Features FusionCharts XT v3.10.0 introduces support for the zoomscatter chart and the zoomline dual yaxis chart. The zoomscatter chart is an extension of the scatter chart with the zooming and panning ability for large number of data points and can be used for finding ...
Release Notes: Updates in 3.9 Improvements In zoomline charts, overlapping of tooltips for data plots having very close values has been fixed. Fixes JavaScript Runtime error, caused by enabling recursive number scaling (scaleRecursively=1) for the secondary yaxis in the dual yaxis multiseries combination chart ...
Release Notes: Updates in 3.8.0 New attributes have been added to customize the legend icon shape. New client-side export feature enables the direct export of charts from Google Chrome and Mozilla Firefox browsers. ...
Release Notes: Updates in v3.7.1 Fixes: Latest version of Firefox (37.0.1) introduced two bugs which were fixed in this release: Data plot border in column 2D charts is now visible. Line segments in all line and area-based charts are now visible. ...
Release Notes: Updates in v3.7 Chart loading messages can now include images, instead of just plain text. Peak data can be selectively shown on the first render of a zoom-line chart. Improved text rendering for Right To Left (RTL) text. Multiline text in legends is now supported. Event handling on hybrid (both, ...