Official Supplier
As official and authorized distributors, we supply you with legitimate licenses directly from 200+ software publishers.
See all our Brands.
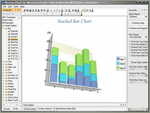
Screenshots: ...
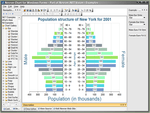
Screenshots: ...
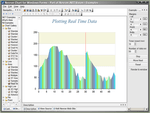
Screenshots: ...
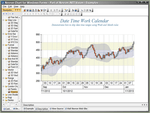
Screenshots: ...
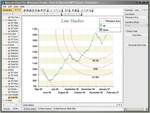
Screenshots: ...
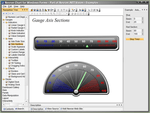
Screenshots: ...
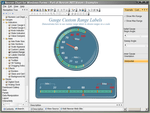
Screenshots: ...
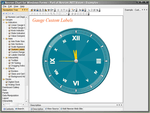
Screenshots: ...
Screenshots: ...
Screenshots: ...
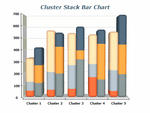
Screenshots: Clustering and stacking may be combined into the same chart. In a 3D scene, clustered and stacked series may be distributed in different depths. ...
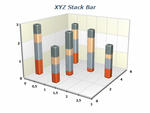
Screenshots: XYZ rendering of stacking and clustering. ...
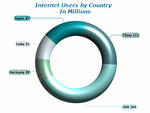
Screenshots: A pie chart may be rendered in different shapes- standard and smooth edge pie, standard, smooth edge or cut edge ring and torus, thus increasing the diversity of chart looks available for advertisements and presentations. The data labels are visualized in ...
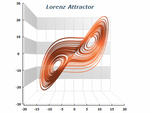
Screenshots: XYZ Line Chart representing Lorenz Attractor – a complex fractal structure corresponding to the long-term behavior of a 3-dimensional dynamic system that exhibits chaotic flow and evolving without ever crossing itself. ...
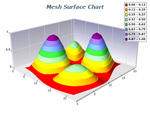
Screenshots: The Mesh Surface chart displays a surface with user-defined y-position, x-position and z-position values for each data point, in contrast to Grid Surface where only y-position (elevation) is user defined. Data points are ordered in a regular network. ...
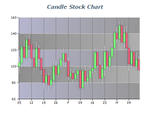
Screenshots: Candle charts are used to plot daily stock data. Each data point resembles a candle, where the candle body is formed by the open and close prices for the day. The high and low prices are displayed by vertical lines above and below the candle body. The ...
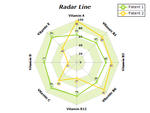
Screenshots: Radar Series, used to create a Radar Chart (Spider Chart, Star Chart), is rendered to a circular graph and is used primarily as a multi-parameter data comparison tool. ...
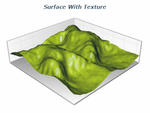
Screenshots: The Grid surface series supports a Fill Effect for the whole surface. The user can apply images, gradients, advanced gradients and patterns to the surface, as well as modify material properties like Specular Color, Emissive Color and Shininess. ...
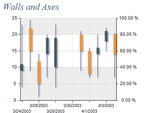
Screenshots: This screenshot demonstrates the following capabilities: adding axes to the left and to the right of the chart back wall; using different and, by need, synchronized scales; using grid lines and major ticks; applying different styles to axes; using stripes ...
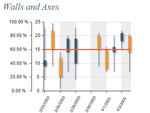
Screenshots: This screenshot demonstrates the following capabilities: adding synchronized detached axes; rotating axis labels. ...