Official Supplier
As official and authorized distributors, we supply you with legitimate licenses directly from 200+ software publishers.
See all our Brands.

Screenshots: Visualize and explore time-based data using built-in data aggregations and on-demand data loading. Start with the big picture and drill down to single transaction level. All with a simple touch or click. 0 ...

Screenshots: ZoomCharts Network visualization lets you visualize and explore graph structures. On-demand data loading, several layouts, custom force feedback algorithm, auras and rich customization options are all available out-of-the box. 0 ...

Screenshots: ZoomCharts is all about simple and efficient data exploration. Use gestures on touch screen devices to navigate- pinch to zoom, drag your finger to expand the timeline, tap to view one data point, and more. 0 ...

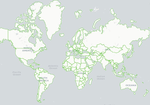
Screenshots: Geo Chart showing shapes for countries. 0 ...

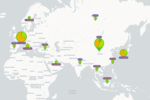
Screenshots: Geo Chart and pie charts showing GDP for different countries. ...

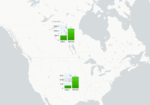
Screenshots: Geo Chart and bar charts showing GDP for different countries by industries. ...

Screenshots: Waterfall chart showing increase based on previous values. ...

Screenshots: Stream chart from zero line showing average open stock prices. ...

Screenshots: Stream chart showing min and max temperature. ...

Screenshots: Stacked multiple level bar chart with time based data 2006 and 2007 GDP for US economy by industries. ...

Screenshots: Stacked column chart with normal stacking showing 2006 and 2007 GDP for US economy by industries. ...

Screenshots: Stacked column chart with based stacking showing highest and lowest stock prices. ...

Screenshots: Stacked bar chart with based stacking showing 2006 and 2007 GDP for US economy by industries. ...

Screenshots: Stacked bar chart using normal stacking showing highest and lowest stock prices. ...

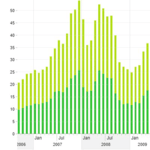
Screenshots: Stacked area chart with normal stacking showing 2006 and 2007 GDP for US economy by industries. ...

Screenshots: Stacked area chart with normal stacking showing highest and lowest stock prices. ...

Screenshots: Stacked area chart with based stacking showing highest and lowest stock prices. ...

Screenshots: Stacked area chart with based stacking showing 2006 and 2007 GDP for US economy by industries. ...

Screenshots: Geo chart with some pinpoint cities. ...

Screenshots: Single level gauge chart showing overview of products beta testers. ...