













官方供應商
我們作為官方授權經銷商,直接提供超過200家開發廠家所發行超過1000個的產品授權給您。
請參閱我們所有的品牌。
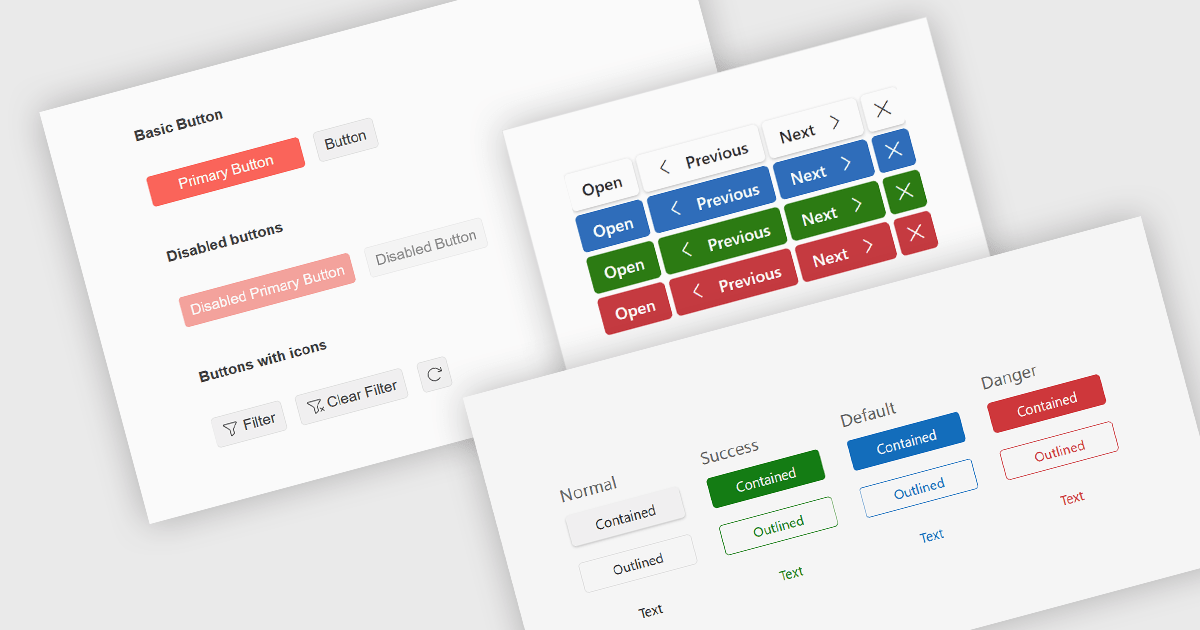
Button editors are user interface (UI) components that enable users to initiate actions within an application, such as submitting data, opening dialogs, clearing input, or executing custom commands. Modern button components often provide options for customizing appearance, icons, size, placement, and behavior, helping developers create consistent, accessible interfaces while supporting application-specific workflows and improving the overall user experience.
Several jQuery data editor collections provide you with button editor controls, including:
For an in-depth analysis of features and price, visit our comparison of jQuery data editors.
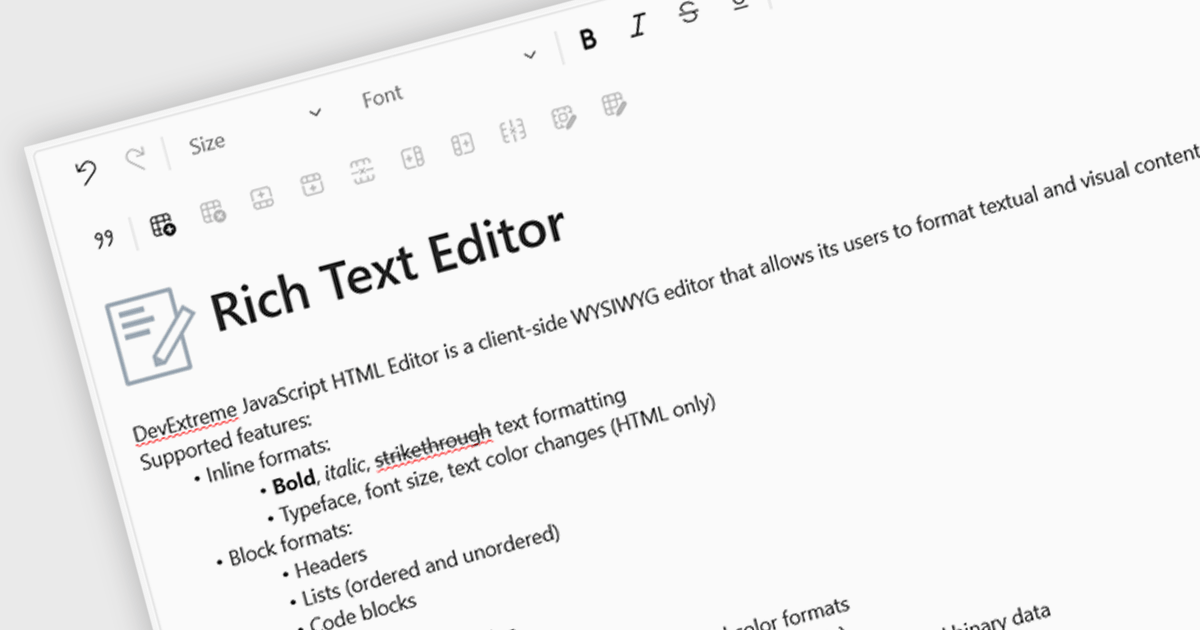
An RTF (Rich Text Format) Editor is a user interface component for Vue.js applications that provides a visual, word processor-style editing experience, allowing users to create and edit formatted content such as bold and italic text, headings, lists, tables, links, images, and other rich content without writing HTML directly. It typically outputs HTML or another structured format for storage and display, while integrating with Vue.js data binding and application state. For software developers, an RTF editor component reduces the effort required to implement advanced text editing features, offers a consistent editing experience across applications, supports extensibility through plugins and customization, and helps accelerate development of content management systems, documentation platforms, messaging applications, and other software that requires user-generated formatted content.
Several Vue.js data editor collections include rich text editing, including:
For an in-depth analysis of features and price, visit our comparison of Vue.js data editor collections.
LightningChart JS is a high-performance JavaScript charting library that utilizes WebGL rendering and GPU acceleration to deliver exceptional performance for a wide range of data visualization needs. It is designed to handle large datasets and complex visualizations with ease, enabling developers to create interactive and visually appealing 2D and 3D charts. Ideal for applications demanding smooth real-time data updates, such as financial platforms, engineering tools, scientific research dashboards, and industrial monitoring systems, LightningChart JS provides a comprehensive API for customization and integration into web-based projects.
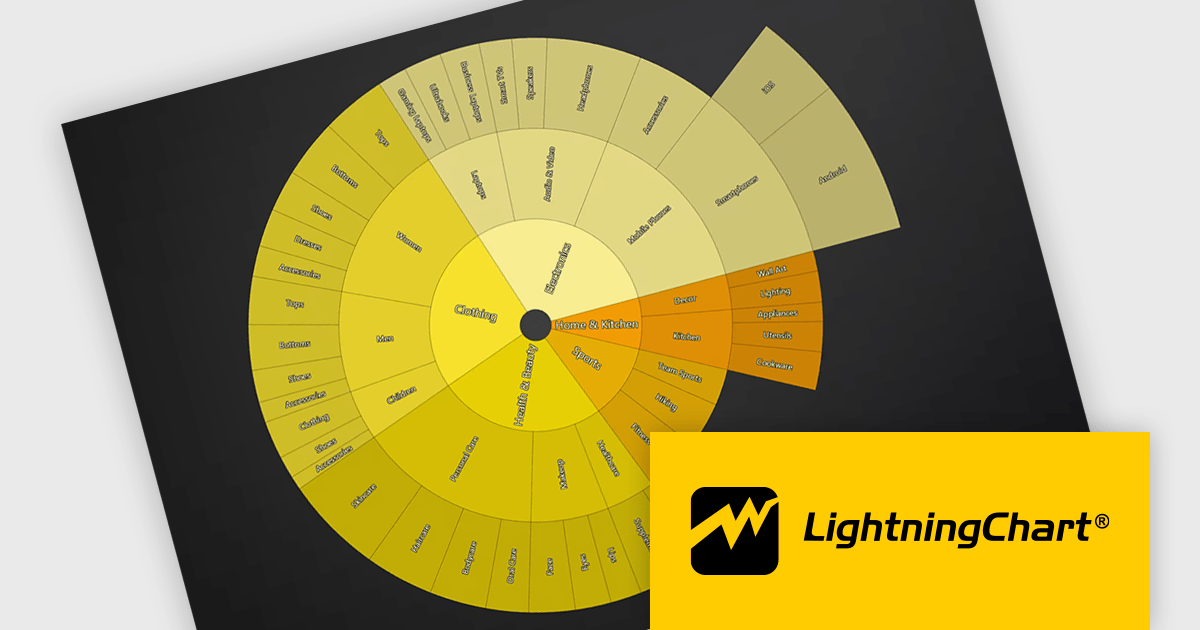
The LightningChart JS v8.3 update introduces Sunburst charts, enabling developers to visualize hierarchical data in a compact and intuitive format that clearly represents part to whole relationships across multiple levels. By displaying nested categories as proportionally sized segments within concentric rings, the chart makes it easier to analyze complex data structures, compare contributions at different hierarchy levels, and identify patterns or dominant categories without requiring multiple visualizations. This helps developers deliver more informative data exploration experiences in applications that rely on organizational, financial, operational, or other structured datasets.
To see a full list of what's new in v8.3, see our release notes.
LightningChart JS is licensed per developer and is available as an annual license with 1 year support. See our LightningChart JS licensing page for full details.
For more information, see our LightningChart JS product page.
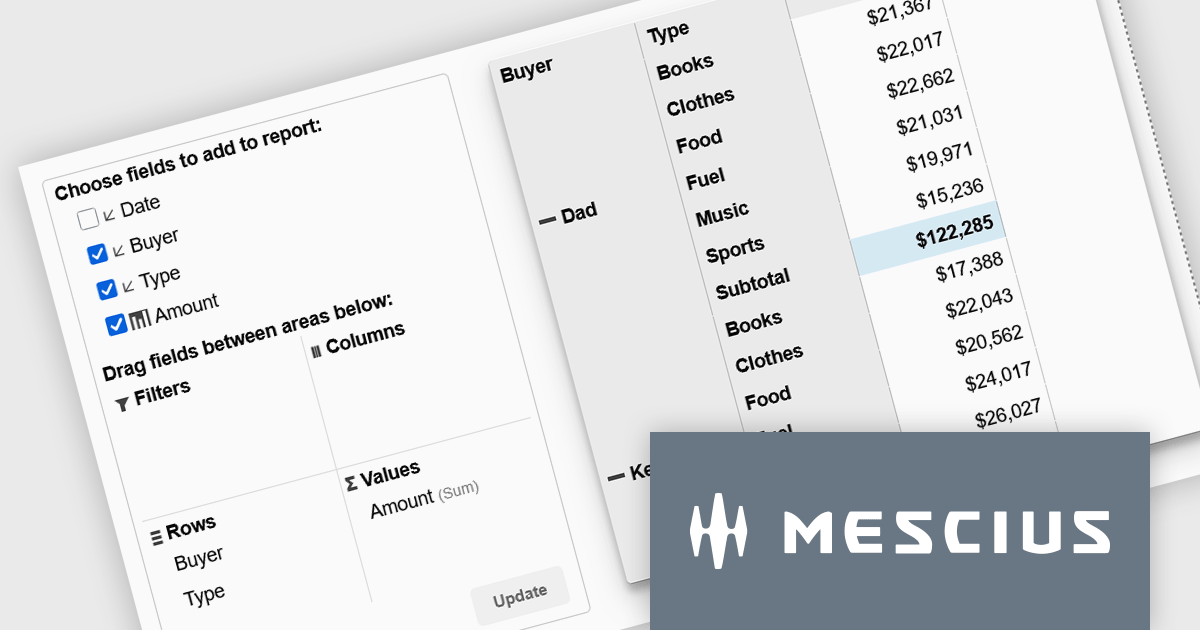
Wijmo is a cutting-edge collection of over 100 high-performance JavaScript UI controls designed for modern enterprise applications. It empowers developers to deliver superior user experiences with fully responsive, touch-friendly, and accessible components and works with any popular JavaScript framework - including Angular, React, Vue, Svelte, or pure JavaScript/TypeScript - for rapid application development across modern web and mobile platforms.
On Wednesday, July 8th at 11:00 AM EST, MESCIUS is presenting a CodeClinic Live Webinar demonstrating how to create executive-ready dashboards without requiring you to build complex aggregation logic from scratch. Joel Parks, Wijmo Product Manager for MESCIUS, will demonstrate how PivotGrid and PivotChart work together to deliver a seamless analytics experience. Key takeaways include:
Register for the Live Webinar today and mark your calendar for July 8th.
Wijmo is licensed per developer. Developer Licenses are perpetual and include 1 year Subscription which provides upgrades, including bug fixes and new features. See our Wijmo licensing page for full details.
Learn more on our Wijmo product page.
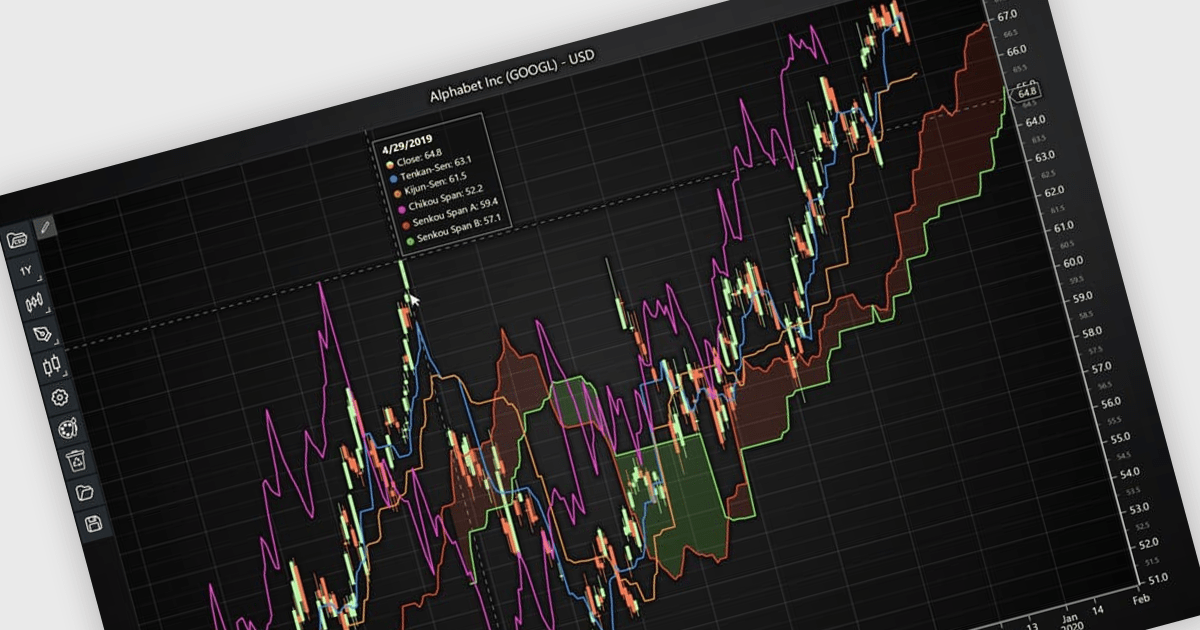
Chart indicators are tools that display calculated data on a chart to help users identify trends, measure momentum, recognize support and resistance levels, and spot potential reversals. By presenting complex market data as clear visual signals, they simplify analysis, support faster decision making, and help users uncover opportunities. Common use cases include tracking trend strength, confirming entry and exit points, and identifying key price levels where market direction may change.
Several JavaScript charting components provide support for indicators within financial charts, including:
For an in-depth analysis of features and price, visit our JavaScript chart components comparison.
聯繫電話: (888) 850 9911
傳真: +1 770 250 6199


