


官方供應商
我們作為官方授權經銷商,直接提供超過200家開發廠家所發行超過1000個的產品授權給您。
請參閱我們所有的品牌。
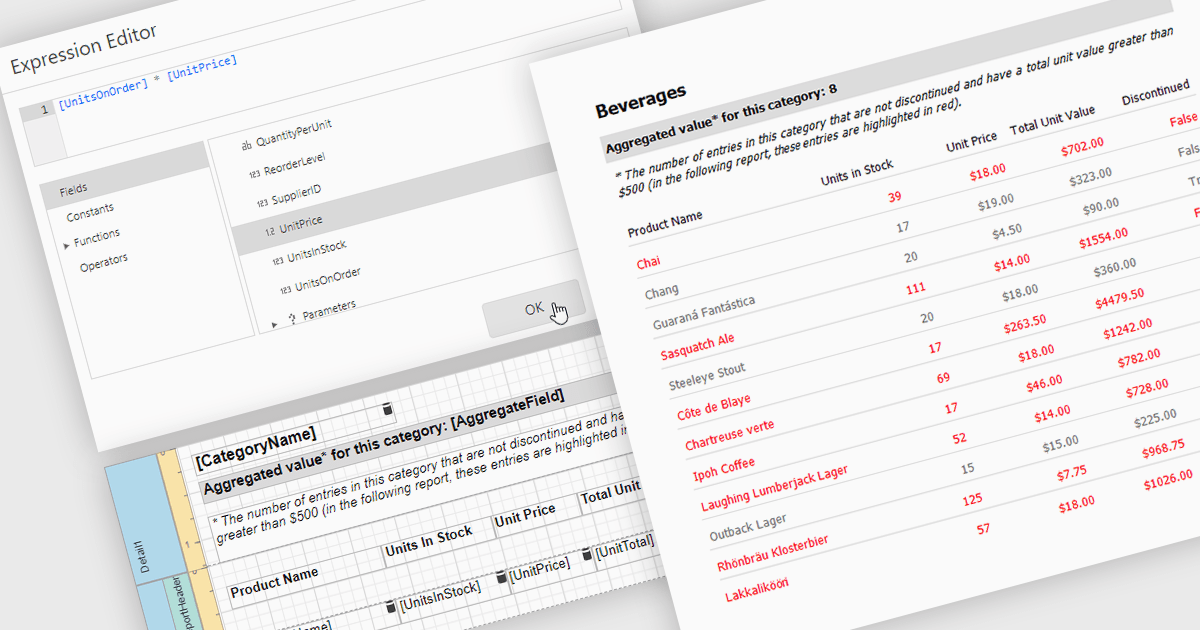
Calculated fields in reports allow you to apply custom expressions to one or more data fields, enabling data to be transformed directly within the reporting environment. This makes it possible to create new metrics such as percentages, ratios, or combined values without changing the underlying data source. As a result, reporting becomes more flexible and efficient, helping users uncover deeper insights and tailor outputs to specific needs. Calculated fields can also be used to group and sort data dynamically, improving how information is organized and presented. Common use cases include calculating profit margins, creating performance indicators, and combining fields to enhance report clarity.
Several .NET reporting controls offer calculated field functionality including:
For an in-depth analysis of features and price, visit our comparison of .NET Reporting controls.
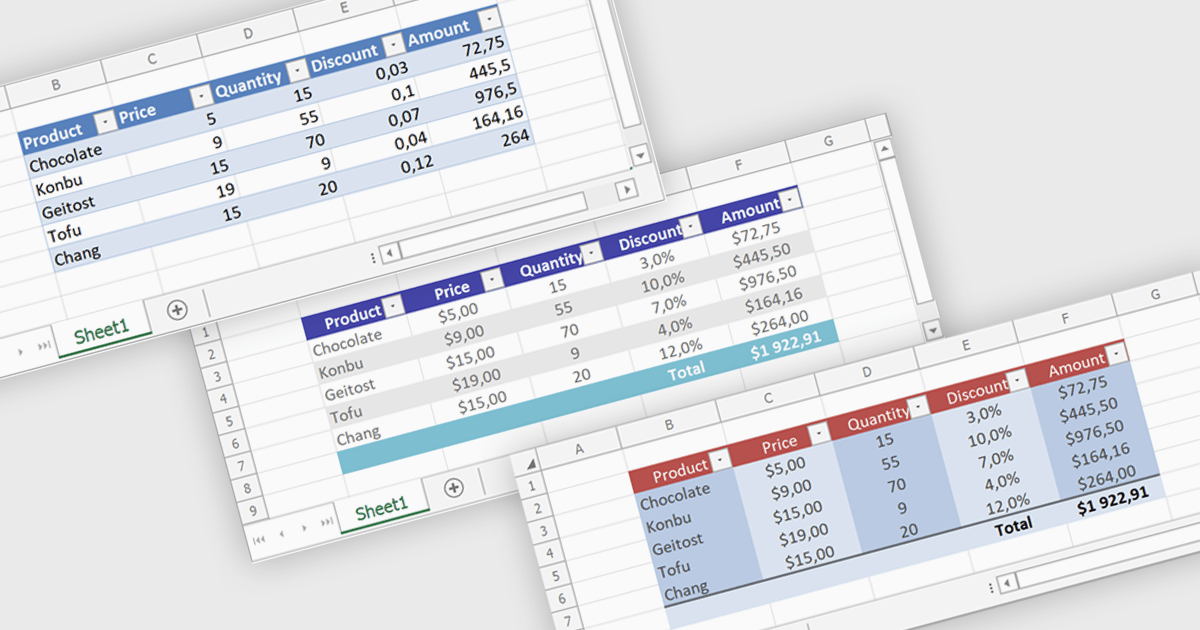
Spreadsheet tables provide a structured way to organize and manage data by grouping related information into defined rows and columns with built in functionality. They enhance usability by enabling automatic sorting and filtering, consistent formula application through calculated columns, and clearer data interpretation with structured references and styling. Tables can also expand dynamically as new data is added, reducing manual updates and errors. Common use cases include managing financial records, analyzing sales performance, tracking inventory, and working with data bound to external sources, making them a powerful tool for both everyday tasks and advanced data analysis.
Several .NET spreadsheet controls offer table support including:
For an in-depth analysis of features and price, visit our .NET spreadsheet controls comparison.
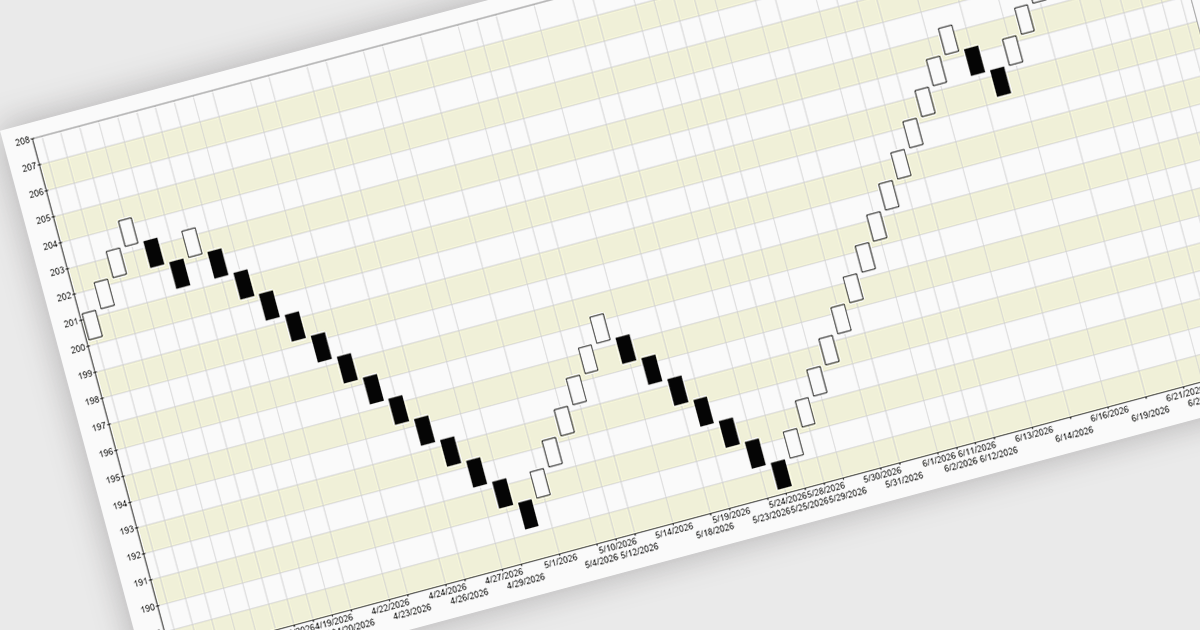
A Renko chart is a type of price chart used in technical analysis that focuses exclusively on price movement rather than time, displaying data as a series of uniform “bricks” that form only when the market moves by a predefined amount. This structure helps filter out minor price fluctuations, making trends and reversals easier to identify while reducing visual noise and improving clarity. As a result, traders can make more informed decisions, confirm trends with greater confidence, and simplify their analysis. Renko charts are commonly used in trend-following strategies, breakout trading, and support and resistance analysis, where a clear view of sustained price direction is more valuable than tracking every small market movement.
Several .NET Chart controls offer a Renko chart including:
For an in-depth analysis of features and price, visit our comparison of .NET Chart controls.
ComponentOne WinForms Edition is a collection of easy-to-use WinForms components that provides access to all updates released within your 1 year subscription period and online support. ComponentOne Winforms Edition includes FlexGrid, FlexChart, FlexReport, InputPanel, Ribbon, DockingTab, and more.
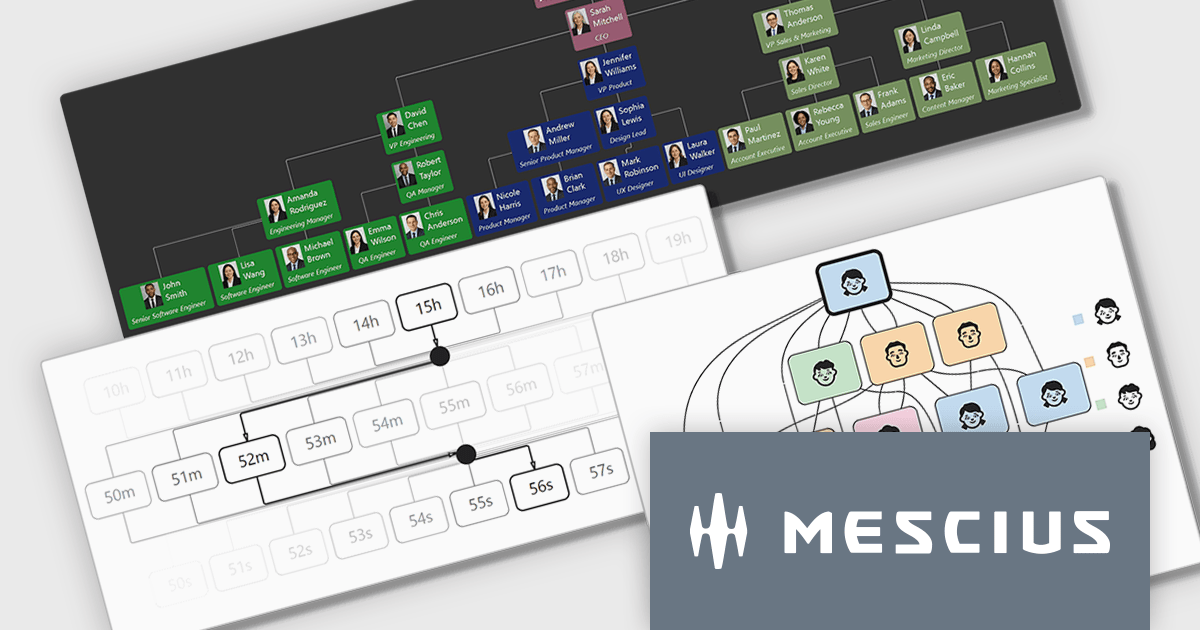
On Wednesday, April 8th at 11:00 AM EDT, MESCIUS is presenting a CodeClinic Live Webinar effecting a deep dive into how .NET developers can convert hierarchical and rule-based datasets into interactive visual diagrams in a Windows Forms application using ComponentOne FlexDiagram. MESCIUS Product Manager Greg Lutz will show you how to bind structured application data to diagram elements, define node relationships, and dynamically generate diagrams using C#. Key takeaways include:
Register for the Live Webinar today and mark your calendar for April 8th.
ComponentOne Studio WinForms is licensed per developer and is available as either a Perpetual or Annual license, depending upon geographic location. Priority Support is also available. See our ComponentOne Studio WinForms licensing page for full details.
Learn more on our ComponentOne Studio WinForms product page.
ICMP support in a .NET communication and messaging control means the component can send or handle Internet Control Message Protocol traffic, typically for functions such as network reachability checks, latency measurement, and diagnostic messaging alongside its core communication features. For software developers, this is useful because it helps applications verify whether endpoints are available, detect network issues earlier, improve monitoring and troubleshooting, and support more responsive connection logic without requiring separate tooling, which can make distributed systems and network-aware applications easier to observe and maintain.
Several .NET Comms & Messaging components offer ICMP support including:
For an in-depth analysis of features and price, visit our comparison of .NET Comms & Messaging components.
聯繫電話: (888) 850 9911
傳真: +1 770 250 6199


