


官方供應商
我們作為官方授權經銷商,直接提供超過200家開發廠家所發行超過1000個的產品授權給您。
請參閱我們所有的品牌。
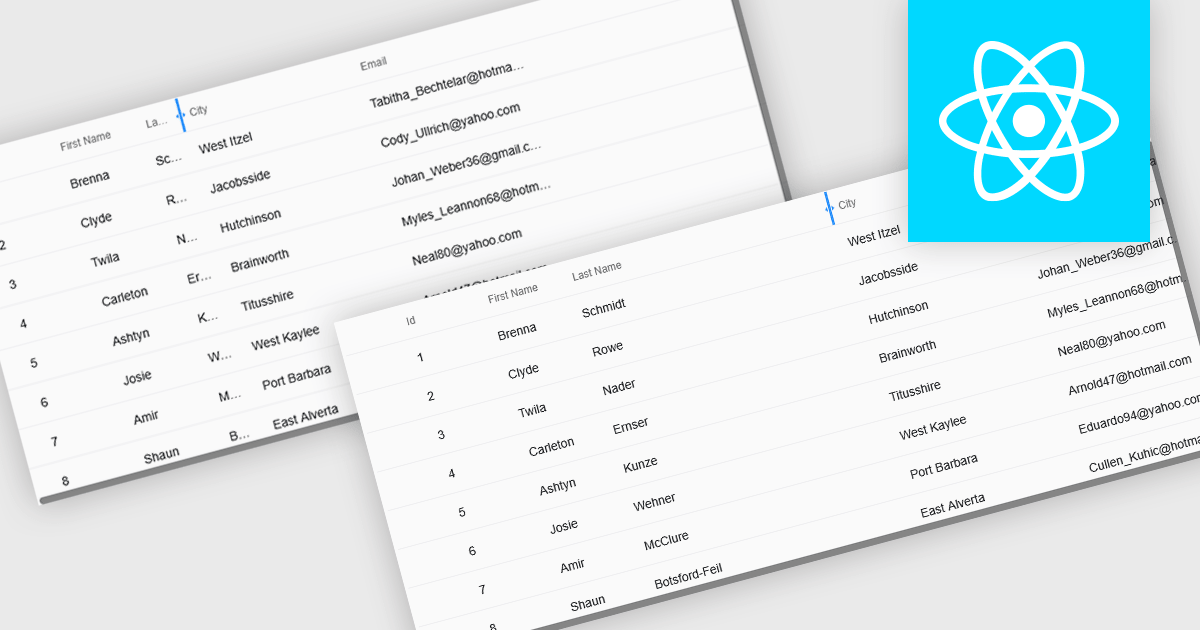
Resizable grid columns let users adjust the width of each column in a data table, giving them direct control over how information is displayed. This improves readability by preventing text from being cut off, reduces clutter by narrowing less important fields, and creates a cleaner, more efficient workspace. It is especially useful with large datasets, long product names, detailed descriptions, or mixed data types, such as expanding a “Description” column to read full text or narrowing numeric columns to compare figures quickly. Whether used in dashboards, admin panels, reporting tools, or data entry systems, column resizing enhances usability, speeds up analysis, and supports a more personalized viewing experience.
Several React grid controls offer support for expanding and resizing columns including:
For an in-depth analysis of features and price, visit our React grid controls comparison.

The NEW Highcharts Grid Pro provides IT professionals with a powerful JavaScript component to build interactive and customizable data grids which enable efficient data editing, filtering, and management within complex datasets, enhancing the usability of data-intensive applications across various technical fields.
On Wednesday, November 19th at 1:00 PM EST, Highcharts Chief Product Officer Øystein Moseng & Product Manager Stian Totland will be presenting a LIVE tutorial-stye and interactive walkthrough of Grid Pro, demonstrating how to edit and validate data seamlessly with Grid Pro's intuitive tools.
As part of the official launch of Highcharts Grid Pro, this webinar will guide you through the many powerful feature of Grid Pro, including:
Register for the LIVE Webinar today and mark your calendar for November 19th!
Infragistics Ultimate is a comprehensive development toolkit designed to streamline the creation of high-performance, visually rich applications across multiple platforms. It includes a wide range of user interface (UI) components and development tools for web, desktop, and mobile applications, supporting frameworks such as Angular, React, Blazor, .NET, and more.
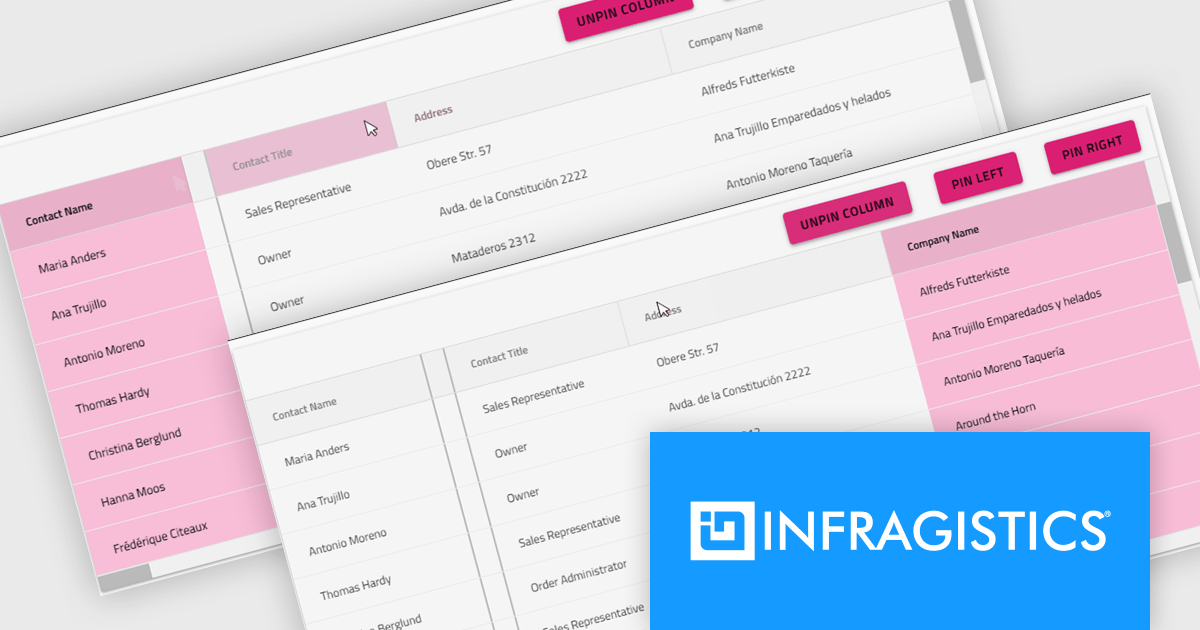
The Infragistics Ultimate 25.2 release includes a feature that lets developers specify individual pinning locations for each grid column, making it possible to fix important data on both the left and right edges of a grid. This added flexibility helps create cleaner, more efficient layouts that keep key information visible at all times. Whether you’re working in Angular, React, Web Components, or Blazor, this capability improves data presentation, simplifies large dataset navigation, and enhances the overall usability of modern web applications.
To see a full list of what's new in version 25.2, see our release notes.
Infragistics Ultimate is licensed per developer and is available as a Perpetual License with a 1, 2 or 3 year support and maintenance subscription. See our Infragistics Ultimate licensing page for full details.
For more information, visit our Infragistics Ultimate product page.
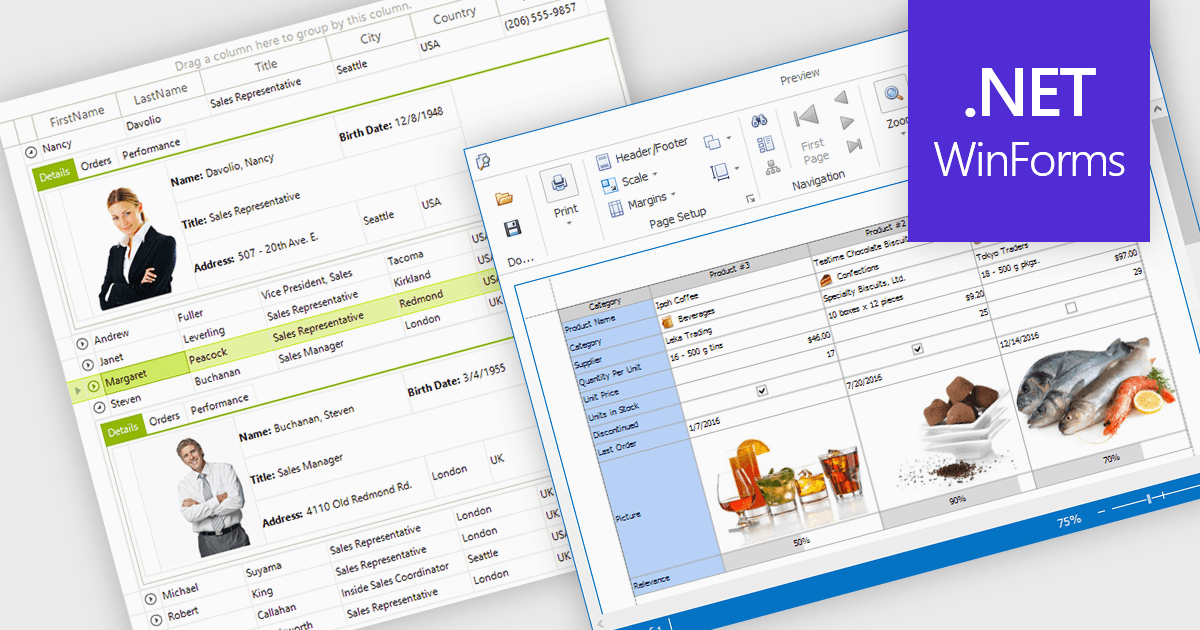
Displaying an image within a grid cell allows developers to combine visual and textual data, making information more intuitive and engaging. This feature enables images such as icons, product photos, or user avatars to appear directly alongside related values, providing immediate visual context and helping users quickly interpret complex datasets. The result is a more dynamic and user-friendly interface that enhances clarity, recognition, and overall usability. Common use cases include showing product images in inventory lists, employee photos in directories, or country flags in international sales reports, allowing users to connect visuals with data for faster understanding and improved decision-making.
Many .NET WinForms grid controls support displaying images within cells, including:
For an in-depth analysis of features and price, visit our comparison of .NET WinForms Grid Controls.
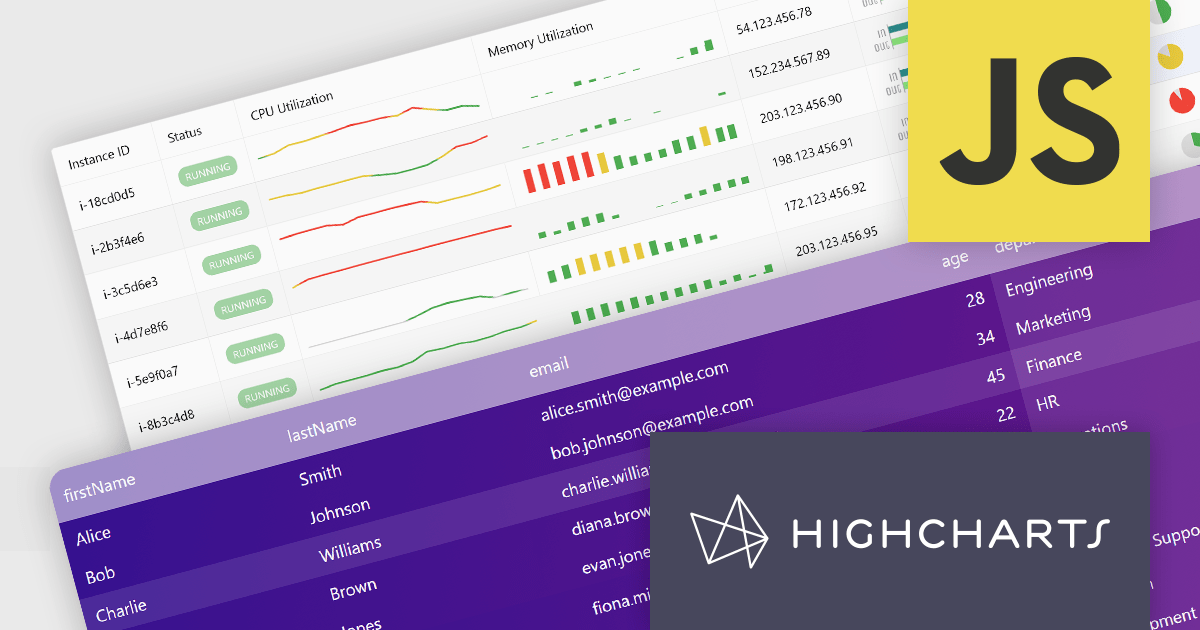
Highcharts Grid Pro is a versatile data grid component developed by the creators of Highcharts, offering both standalone functionality and tight integration within the Highcharts and Highcharts Dashboards ecosystems. It features advanced capabilities such as real-time data binding, column sorting, filtering, inline editing, pagination, and data export, enabling users to work with structured data efficiently. Designed to complement Highcharts' visual components, Grid Pro allows for seamless alignment between data tables and interactive charts when used together, but it can also function independently in applications that require only tabular data interaction. This makes it ideal for a wide range of use cases, including financial platforms, business intelligence tools, and any application where users need to view, edit, and interact with complex datasets directly in the browser.
Highcharts Grid Pro is now available as a standalone component. The v2.0 update delivers a set of professional-grade enhancements focused on improving usability, data control, and visual clarity. It introduces interactive editing with built-in editors for text, numbers, and dates, making in-grid updates more intuitive. Configurable validation rules ensure data accuracy, while embedded sparklines, powered by Highcharts Core, provide immediate visual insights alongside the data. Features such as pagination, column filtering, and sorting make it easier to manage and explore large datasets. Developers can also implement custom behaviors and event hooks to align the grid with specific application needs.
For a limited time you can benefit from special introductory pricing!
Save 50% off new licenses of Highcharts Grid Pro or Highcharts Dashboards when bought individually or when combined in a bundle with other products from Highsoft including Highcharts Core, Stock, Maps and Gantt.
Highcharts Grid Pro is licensed per developer as an Annual or Perpetual License with Internal, Saas, SaaS+ and OEM distribution options. The annual license includes support and all product updates for 1 year and must be renewed to continue to use the software. The perpetual license includes an "Advantage Subscription" which provides support and updates for a set period of time. If you do not renew Advantage then you may continue to use the software at the last release available during the active Advantage period. See our Highcharts Grid Pro licensing page for full details.
Learn more on our Highcharts Grid Pro product page.
聯繫電話: (888) 850 9911
傳真: +1 770 250 6199


