


官方供應商
我們作為官方授權經銷商,直接提供超過200家開發廠家所發行超過1000個的產品授權給您。
請參閱我們所有的品牌。
Direct Oracle Access by Allround Automations is a component library designed for developers using Embarcadero Delphi and C++Builder that provides direct connectivity to Oracle databases, without requiring middleware like the Borland Database Engine (BDE) or ODBC. It allows developers to build high-performance applications with native Oracle access by leveraging the Oracle Call Interface (OCI) directly through a lightweight integration. The component set supports advanced Oracle features such as LOBs (Large Objects), PL/SQL blocks, array DML operations, and the Direct Path Load Engine, making it suitable for applications that demand efficient database interaction and low-latency access. By bypassing the traditional client layers, it simplifies deployment and enhances execution speed for Oracle-based solutions.
The Direct Oracle Access v4.1.4.1 (October 2025) update adds support for Embarcadero Delphi and C++Builder 13 Florence, ensuring full compatibility with the compiler, runtime library, and platform enhancements introduced in the latest IDE version. This update allows developers to continue leveraging Direct Oracle Access for building Oracle-integrated applications while benefiting from the improvements in the Florence release, such as enhanced debugging tools, refined language features, and updated platform support.
To see a full list of what's new in v4.1.4.1 (October 2025), see our release notes.
Direct Oracle Access is licensed per developer and is available in two editions: Standard, with core Oracle access components, and Object, which adds support for Oracle’s object-relational features. Optional add-ons include source code access, Oracle Monitor Pro for advanced monitoring, and an Annual Service Contract for support and updates. See our Direct Oracle Access licensing page for full details.
For more information, see our Direct Oracle Access product page.
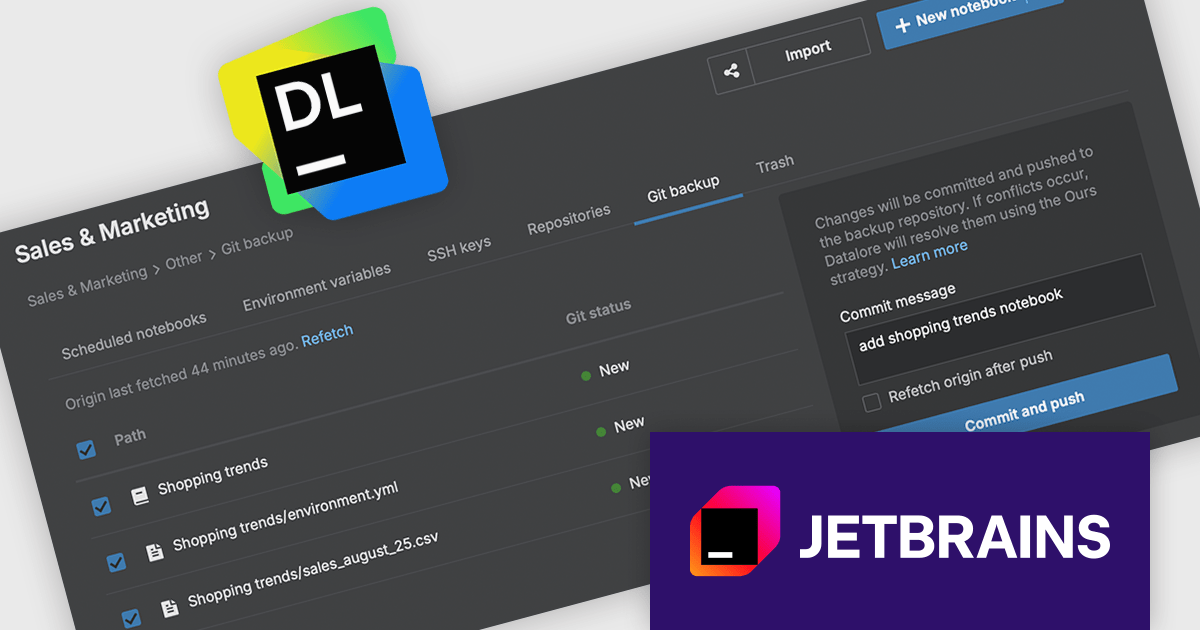
JetBrains Datalore is a collaborative data science platform that streamlines data exploration, analysis, and visualization through Jupyter-compatible notebooks. It empowers teams with features like automatic visualizations, pre-configured environments, interactive controls, and seamless collaboration functionalities. Datalore offers both cloud-based and self-hosted deployment options, catering to both individual and team-based data science workflows.
The Datalore 2025.5 update includes a new capability that allows users to export their entire workspace - including notebooks and associated files - directly to a Git repository. This feature is particularly useful for teams and individuals looking to maintain version history, safeguard their work, and collaborate more effectively. By integrating with Git, Datalore aligns more closely with established software development practices, offering a familiar and reliable method for managing changes over time.
To see a full list of what's new in version 2025.5, see our release notes.
Datalore is licensed per user, and is available as a commercial annual subscription license. See our Datalore licensing page for full details.
For more information, visit our Datalore product page.
InterBase by Embarcadero is a high-performance, embeddable SQL database engine designed for developers building cross-platform applications. It supports key features such as multi-version concurrency control (MVCC), strong data encryption, and disaster recovery through point-in-time recovery and journaling. Known for its small footprint and minimal administration requirements, InterBase is commonly used in embedded, mobile, and desktop environments where reliable, low-maintenance data storage is essential. It offers integration with development tools like Delphi and C++Builder, making it a practical choice for applications requiring robust local data processing.
The InterBase 15 release significantly strengthens its security model with encryption and authentication upgrades built into the core. This version introduces AES‑256 encryption as the default for securing data both at rest and in transit. It also now uses SHA‑256 password digests, offering more robust defense against unauthorized access by improving how passwords are stored and verified. These updates make InterBase 15 a safer choice for applications where data integrity and confidentiality are critical.
To see a full list of what's new in version 15, see our release notes.
For more information, visit our InterBase product page.
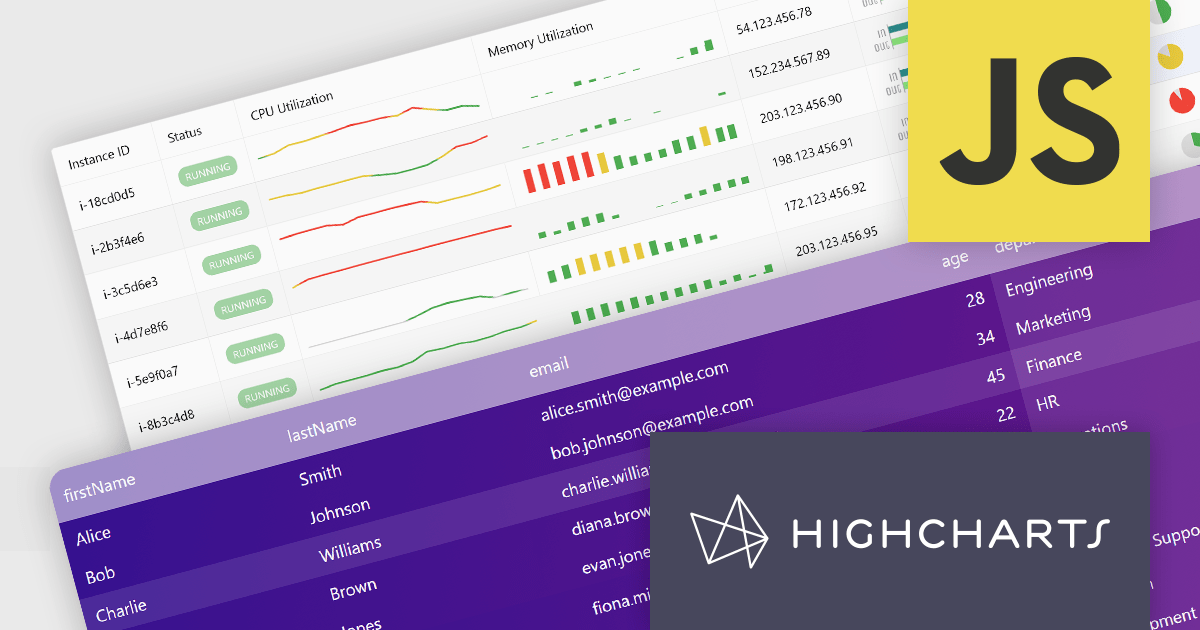
Highcharts Grid Pro is a versatile data grid component developed by the creators of Highcharts, offering both standalone functionality and tight integration within the Highcharts and Highcharts Dashboards ecosystems. It features advanced capabilities such as real-time data binding, column sorting, filtering, inline editing, pagination, and data export, enabling users to work with structured data efficiently. Designed to complement Highcharts' visual components, Grid Pro allows for seamless alignment between data tables and interactive charts when used together, but it can also function independently in applications that require only tabular data interaction. This makes it ideal for a wide range of use cases, including financial platforms, business intelligence tools, and any application where users need to view, edit, and interact with complex datasets directly in the browser.
Highcharts Grid Pro is now available as a standalone component. The v2.0 update delivers a set of professional-grade enhancements focused on improving usability, data control, and visual clarity. It introduces interactive editing with built-in editors for text, numbers, and dates, making in-grid updates more intuitive. Configurable validation rules ensure data accuracy, while embedded sparklines, powered by Highcharts Core, provide immediate visual insights alongside the data. Features such as pagination, column filtering, and sorting make it easier to manage and explore large datasets. Developers can also implement custom behaviors and event hooks to align the grid with specific application needs.
For a limited time you can benefit from special introductory pricing!
Save 50% off new licenses of Highcharts Grid Pro or Highcharts Dashboards when bought individually or when combined in a bundle with other products from Highsoft including Highcharts Core, Stock, Maps and Gantt.
Highcharts Grid Pro is licensed per developer as an Annual or Perpetual License with Internal, Saas, SaaS+ and OEM distribution options. The annual license includes support and all product updates for 1 year and must be renewed to continue to use the software. The perpetual license includes an "Advantage Subscription" which provides support and updates for a set period of time. If you do not renew Advantage then you may continue to use the software at the last release available during the active Advantage period. See our Highcharts Grid Pro licensing page for full details.
Learn more on our Highcharts Grid Pro product page.
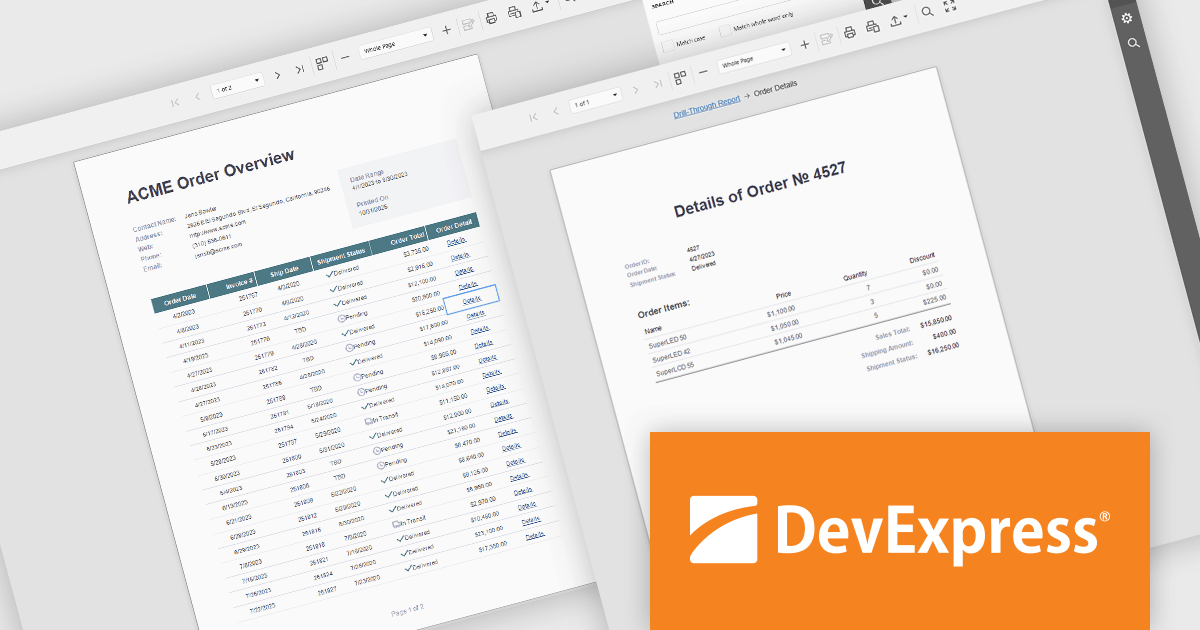
DevExpress Reporting is a comprehensive suite of reporting tools that help developers create visually stunning and highly customizable reports for various applications. With its rich feature set, including data binding, layout design, printing, and exporting capabilities, DevExpress Reporting enables the efficient creation of reports that meet the most demanding business requirements.
DevExpress Reporting enhances data analysis by enabling drill-through reports, allowing developers to create interactive report designs that link summary-level data to detailed information. This feature provides a streamlined way for users to explore data hierarchies without leaving the main report, improving usability and workflow efficiency. By clicking on data points, users can view related details in a connected report, ensuring a cohesive and intuitive data exploration experience. This capability helps developers deliver more dynamic, context-rich reporting solutions that support faster and more informed decision-making.
DevExpress Reporting is licensed per developer and is available as a Perpetual License with a 12 month support and maintenance subscription. See our DevExpress Reporting licensing page for full details.
DevExpress Reporting is available to buy in the following products:
聯繫電話: (888) 850 9911
傳真: +1 770 250 6199


