













官方供應商
我們作為官方授權經銷商,直接提供超過200家開發廠家所發行超過1000個的產品授權給您。
請參閱我們所有的品牌。
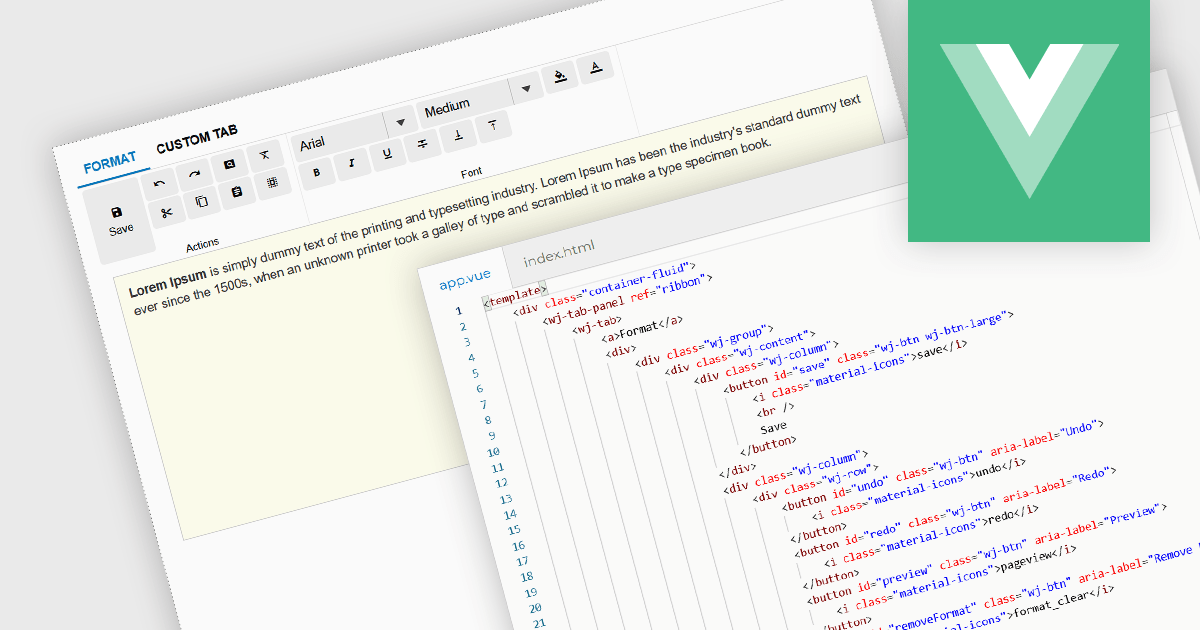
Ribbon bars are graphical user interface (GUI) patterns that organize commands and features into a series of tabs, each containing grouped controls such as buttons, dropdowns, and galleries. Widely adopted in modern software applications, ribbons present functionality in a structured and visually accessible layout to improve discoverability. This approach reduces reliance on deeply nested menus and toolbars, enabling users to locate relevant tools more quickly based on context.
Several Vue.js user interface suites provide ribbon functionality, including:
For an in-depth analysis of features and price, visit our comparison of Vue.js UI suites.
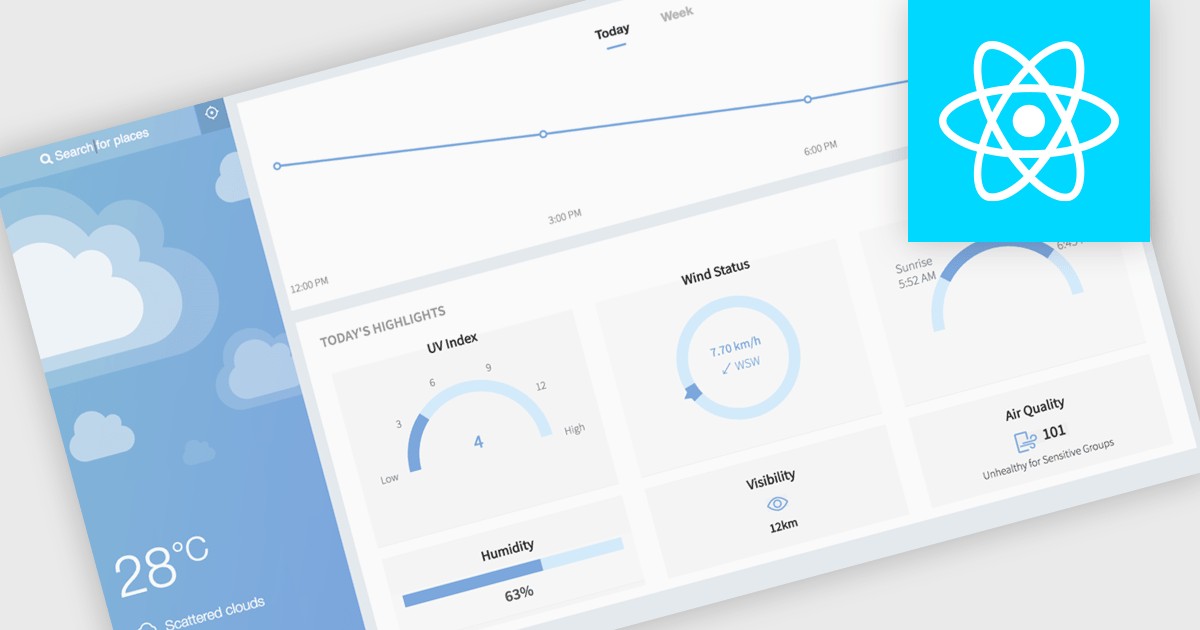
Gauge charts are data visualizations that display a single value within a defined range, making it easy to understand status or progress at a glance. Often styled like a speedometer, they show where a value sits between minimum and maximum thresholds, using color to indicate different levels. This provides clear, immediate insight without detailed analysis. Key benefits include quick understanding, intuitive design, and strong visual emphasis on limits or targets. Gauge charts are commonly used in dashboards to track KPIs, monitor targets, show completion percentages, or highlight key metrics in a simple and effective way.
Several React charting components also offer gauges, including:
For an in-depth analysis of features and price, visit our comparison of React chart components.
Blazorise is a versatile component library that empowers developers to build modern and feature-rich web applications using Blazor, a client-side web development framework from Microsoft. It offers a comprehensive collection of user interface components, including buttons, forms, charts, and navigation elements, all built with accessibility and responsiveness in mind.
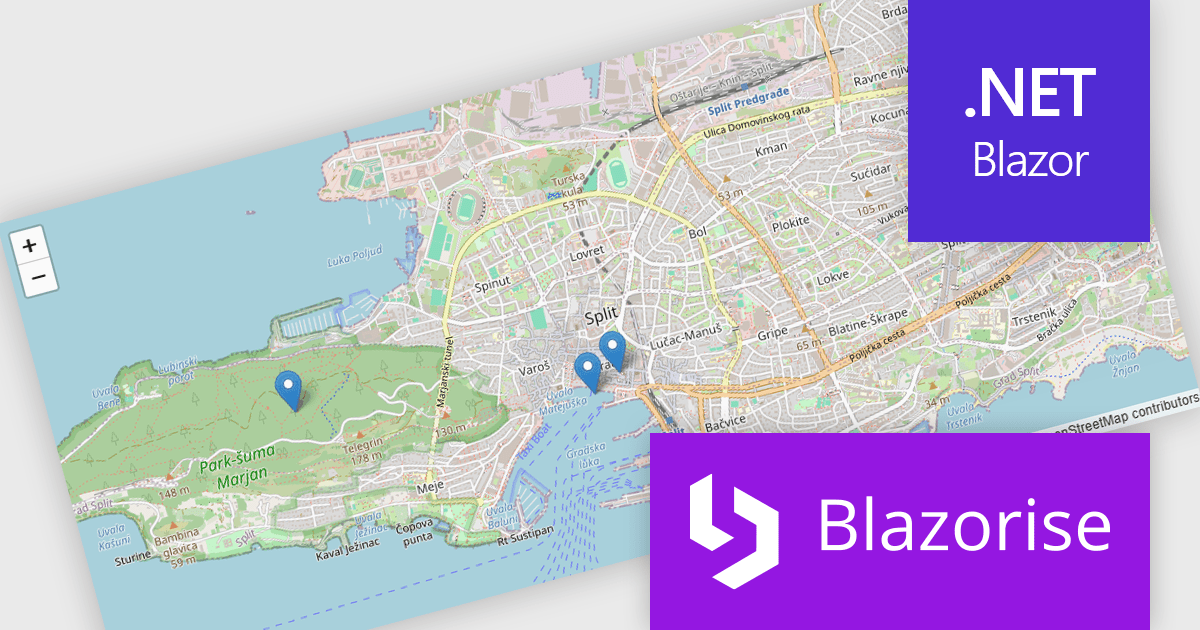
The Blazorise 2.1 update introduces a new maps component that enables developers to build interactive mapping functionality using a provider-neutral component model, allowing applications to remain independent of any specific mapping library. By abstracting core concepts such as maps, layers, markers, and shapes, developers can implement rich, data-driven map experiences with support for events, programmatic control, and synchronization between application state and the rendered map, while retaining the flexibility to adopt additional mapping providers in the future without requiring significant code changes.
To see a full list of what’s new in version 2.1, see our release notes.
Blazorise is licensed per developer and includes a 1 year subscription for updates and support. Professional, Enterprise, and Enterprise Plus editions are available, each offering tailored levels of support and service to meet varying business needs. See our Blazorise licensing page for full details.
For more information, visit our Blazorise product page.
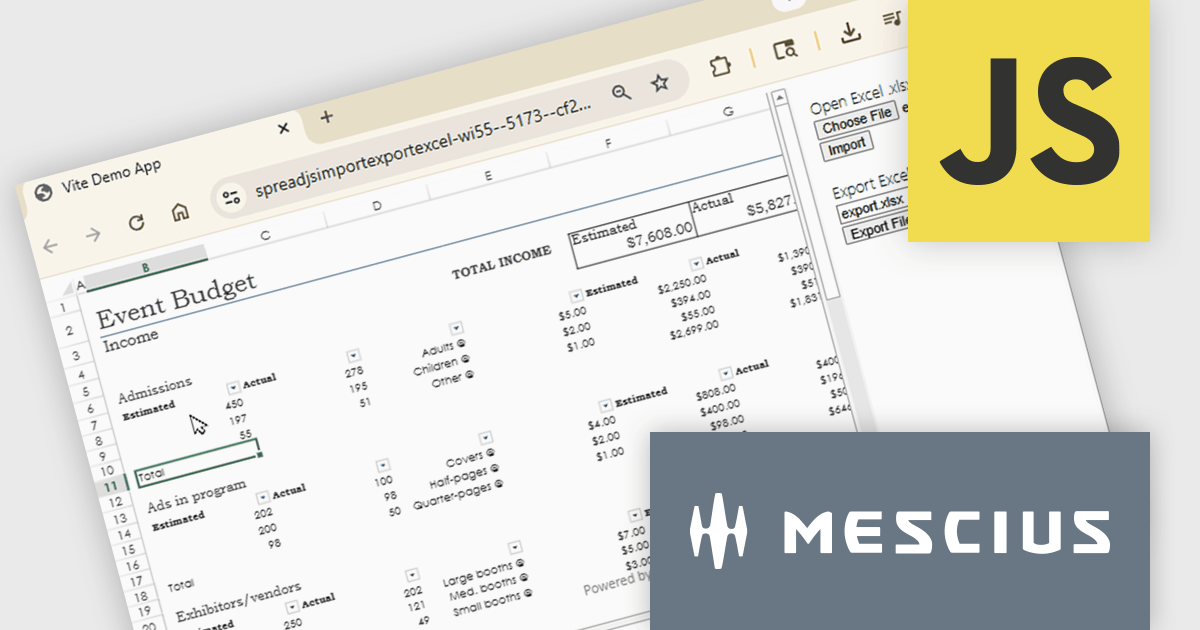
SpreadJS is a complete enterprise JavaScript spreadsheet solution used to create financial reports and dashboards, budgeting and forecasting models, scientific, engineering, healthcare, education, science lab notebooks, and other similar JavaScript business applications. Leverage the high-speed calculation engine with over 500 Excel built-in functions in 19 languages, to deliver true Excel-like spreadsheet experiences with zero dependencies on Excel.
In this online tutorial from MESCIUS, you will learn the critical steps allowing you to import/export XLSX files using JavaScript. Steps include:
Detailed sample code is included to help you along the way.
View the tutorial now and get started working with spreadsheet files in your JavaScript applications.
SpreadJS is licensed per developer and includes 1 Year Maintenance (major and minor version releases and unlimited support phone calls). SpreadJS requires an Annual or Perpetual Deployment License. The optional Add-ons are available at an additional cost, and require a SpreadJS license. See our SpreadJS licensing page for full details.
For more information, visit our SpreadJS product page.
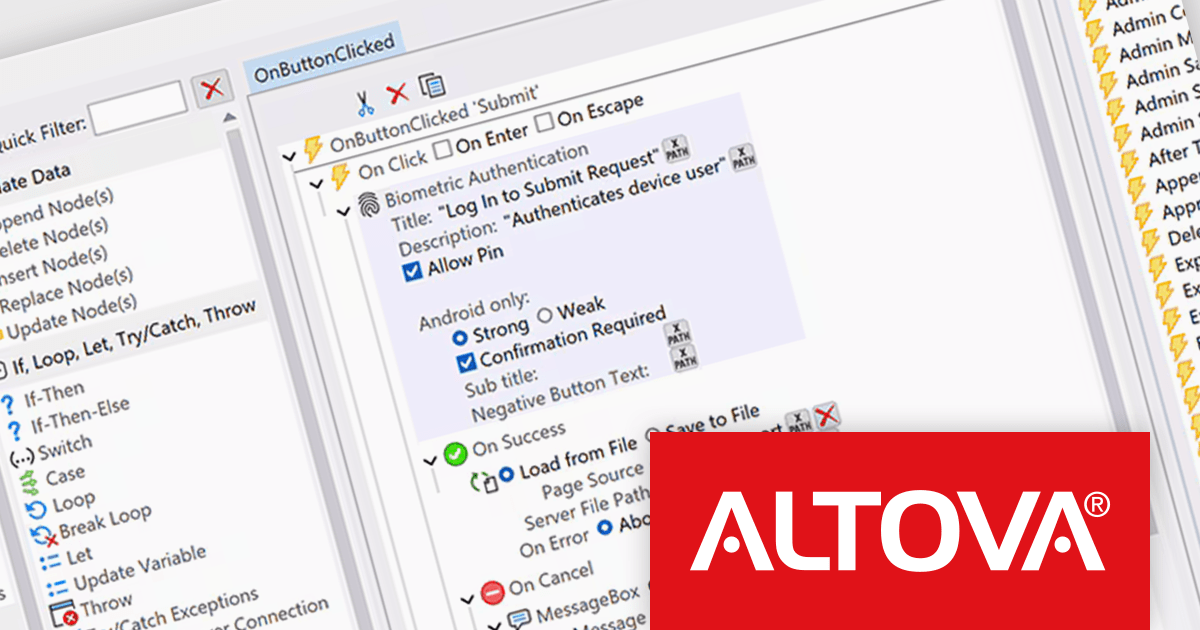
Altova MobileTogether is a rapid app development platform that empowers anyone, regardless of coding experience, to build sophisticated data-driven apps for all mobile and desktop platforms. With its visual UI design, drag-and-drop functionality, and powerful Action Tree programming language, MobileTogether improves the development process, enabling you to create custom database apps, integrate with backend systems, and deploy secure solutions swiftly and cost-effectively.
The MobileTogether 10.3 release introduces support for biometric authentication in client applications, allowing developers to incorporate face recognition or fingerprint scanning as a secure and convenient login method. An optional runtime function lets apps detect whether a user’s device supports biometric capabilities, enabling intelligent decisions about when to present authentication prompts. To ensure consistent access across devices and user preferences, a PIN-based fallback can also be configured, providing an alternative when biometric options are unavailable or not set up. Together, these enhancements offer a practical approach to improving both security and user experience in mobile solutions.
To see a full list of what's new in version 10.3, see our release notes.
MobileTogether is licensed per server core as an annual subscription. See our MobileTogether licensing page for full details.
For more information, visit our MobileTogether product page.
聯繫電話: (888) 850 9911
傳真: +1 770 250 6199


