News Archive

Streamline Code Reviews Within Your Python Editor

April 8, 2024Product Update
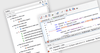
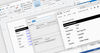
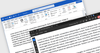
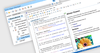
PyCharm 2024.1 brings a smoother code review experience for GitHub and GitLab users, allowing for direct collaboration right inside the editor.

Visualize and Interpret Complex Data in jQuery

April 8, 2024Feature Highlight
Adding heatmaps or treemaps to your jQuery app fosters improved decision-making by displaying data in an engaging and intuitive manner.

Enhance AI-generated SQL Queries with Schema Info

April 5, 2024Product Update
DataGrip 2024.1 allows you to describe what you want in plain English before creating queries for you, using your database structure as a guide.

Discover Memory Leaks and Optimize .NET 8 Apps

April 5, 2024Product Update
ANTS Memory Profiler v11.3.0 now lets you identify and fix memory-related issues within your .NET 8 codebase.

Manage the State of DataGrids in Blazor Apps

April 5, 2024Product Update
Blazorise v1.5 adds the ability to save and load the DataGrid state as needed, enhancing the end user experience.

Present Complex Data in a Clear and Organized Way

April 4, 2024Product Update
Infragistics Ignite UI for Blazor 23.2.189 adds a new hierarchical data grid which helps users find the information they need more quickly.

Create Diagrams in Your WinForms Apps

April 4, 2024Feature Highlight
Diagramming controls allow users to visually represent complex systems clearly and efficiently using mindmaps, flowcharts and more.

Break Down Language Barriers in Your Reports

April 4, 2024Feature Highlight
Leverage a React reporting tool with localization support to make reports accessible for users across the globe.

Catch Data Entry Errors Early in Your Vue.js Apps

April 4, 2024Feature Highlight
Data Editor controls with validation support prevent end users entering incorrect information into your apps.

Reduce Errors Caused by Missing Dependencies

April 4, 2024Feature Highlight
Installation tools with prerequisite management features help to ensure necessary versions are present before your application is run.

Directly Query and Manipulate XML Data

April 4, 2024Feature Highlight
Use XQuery to efficiently extract specific information, transform structures, and analyze content within XML documents.

Handle Form Field Data in Your Angular App

April 4, 2024Feature Highlight
Learn how to use the Text Control Document Viewer to deploy forms for end users to fill out and save the retrieved data.

Dynamically Summarize Large Datasets

April 4, 2024Feature Highlight
Leverage pivot table functionality in .NET spreadsheet controls to simplify data exploration and analysis within your applications.

Streamline Workflows with Word to PDF Conversion

April 3, 2024Feature Highlight
Let your app convert Microsoft Word files to PDF, making documents more accessible and easier for users to share across devices.

Empower Focused User-Driven Data Exploration

April 3, 2024Product Update
Syncfusion Essential Studio Blazor 2024 Volume 1 provides users with powerful new options to facilitate precise, targeted filtering of grid data.

Avoid Formatting Issues when Pasting Markdown

April 3, 2024Product Update
Oxygen XML Editor 26.1 makes it easier to paste Markdown content into documents without having to manually convert the formatting.

Connect Your ODBC-Based Applications to Firebird 5

April 3, 2024Product Update
Devart ODBC Driver for Firebird 3.6.0 allows you to leverage the newest features and improvements that come with the latest version of Firebird.

Create PDF Forms In-Browser via Confluence

April 3, 2024Product Update
ONLYOFFICE Confluence Connector v5.0.0 lets you create interactive PDF forms that can be filled out directly in Confluence.

Manage CSS with Structured Document Tools

April 3, 2024Feature Highlight
Structured document tools can consolidate style management, boosting efficiency by enabling CSS manipulation alongside content editing.

Build Feature-Rich WPF Charts with Less Coding

April 3, 2024Feature Highlight
Infragistics Professional 23.2 empowers developers with a comprehensive collection of 60+ WPF charts for creating informative data visualizations.