Improve Database Management Capabilities
September 13, 2024Product Update
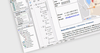
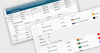
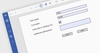
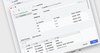
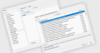
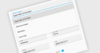
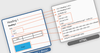
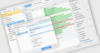
Total Network Inventory 6.3.0 adds a new database storage management window, enabling users to connect to storages created in their databases.
Tel: (888) 850 9911
Fax: +1 770 250 6199