DataViewsJS released

Advanced JavaScript data presentation controls.
August 27, 2019
New Product

Features

  • Advanced JavaScript data presentation controls - DataViewsJS enables you and your users to easily and professionally customize the presentation of data. Visualize data using Grid, Horizontal Grid, Card, Masonry, Kanban, Timeline, and Gantt.
  • Full Framework Support - Full Support for JavaScript frameworks. Support for Angular, React, and Vue.
  • Virtual Loading and Server-Side Paging - Only load the specific data that you need from a server as you need it to better optimize the performance of your application.
  • High Performance - Fast, full-featured, and customizable data grid for efficient data display and editing.
  • Standalone Calculation Engine - Leverage the powerful calc engine to perform calculations on any set of JSON data. With the calculation engine, your computing power is optimized for large data and complex calculations. The calculation engine can also be used separately from DataViewsJS.
  • Localization - Includes localized resources for Chinese, Japanese and Korean. Additional languages can be easily added.
  • Professional Layout Plugins - Modern data presentation patterns such as those you see on social networks and other sites become easy when you use DataViewsJS interchangeable layouts.
    • Grid - Present your data in traditional tabular row and allow the user to sort, filter, group and edit with ease.
    • Tree Grid - A quick and easy tree view for your hierarchical data. Includes special aggregation functions to summarize the data easily.
    • Horizontal - Columns can be arranged horizontally to create informative product comparison tables.
    • Card - Lays out each row as easily formatted cards. Display cards in a variety of ways such as a list, in a grid, or in a trellis.
    • Trellis - Trellis card display for perfect Kanban views of your tasks.
    • Gantt - Use the Gantt column to visualize project data ranges.
    • Calendar - Creative calendar implementations, sales reports and weather forecasts.
    • Timeline - Make each row an object on a timeline with options such as date and line placement and header toggle.
    • Masonry - A size perfect gallery of your images with infinite scrolling, all with a single line of code.
  • Layouts - Each layout includes a full set of options and an API, so customization is simple. Decide between vertical or horizontal alignment, determine field placement, or format the overall look.
  • Row Templates - Create templates for rows, groups, headers, and footers with plain HTML and CSS. Use templates to present a row on multiple lines in a traditional tabular display or create any kind of card you can imagine.
  • Built-in and Custom Data Field Presenters - Use configurable presenters to determine how to show data fields, columns, and headers. Choose from built-in presenters, such as Sparklines, progress bars, and image containers or write your own.
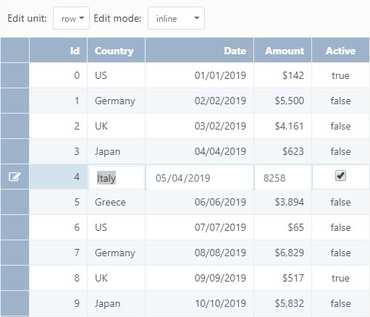
  • Customizable Edit Modes - Allow users to edit data inline, with a pop-up form, or with a drop-down form. DataViewsJS will display fields in data appropriate controls such as text fields for strings and spinners for numbers. Each method is completely customizable, so you can make it look and behave the way you need.
DataViewsJS

DataViewsJS

Advanced JavaScript data presentation and datagrid platform.

Got a Question?

Live Chat with our MESCIUS (formerly GrapeCity) licensing specialists now.