Infragistics Ignite UI for React 19.2

Adds Spreadsheet and Map controls.
November 20, 2019
New Version

Features

  • New React Maps, Spreadsheets and Grids
    • Display data that contains geographic locations or geo-spatial data on geographic imagery maps.
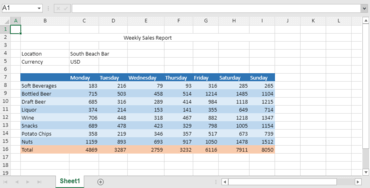
    • Embed Excel document creation and editing experiences right into your React applications.
    • Use the Tree Map to show users the relative weighting of data points at more than one level (also known as heatmaps in the financial industry).
  • Native Open Fin FDC3 - Get performance and security using FDC3-enabled experiences with Infragistics and OpenFin.
React Spreadsheet

Infragistics Ignite UI for React

High-performance data grid and high-volume data charts.

Got a Question?

Live Chat with our Infragistics licensing specialists now.