Stimulsoft Reports.Web 2020.2.1

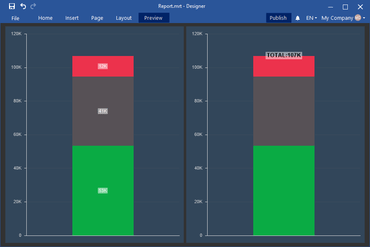
Adds the ability to show overall result for Stacked Area charts.
February 6, 2020
New Version

Features

  • New Waterfall Chart - A waterfall chart is used to display a running total when you add or remove values.
  • Overall Results for Stacked Area Charts - This release adds the ability to display the total for each argument in a Dashbaord Stacked Area chart.
  • Dark Green Theme for Dashboards - To apply the new style, select the Dashboard and select the Dark Green theme from the styles menu.
Overall result for Stacked Area charts

Stimulsoft Reports.WEB

Add flexible and feature rich reports to your Web applications.

Got a Question?

Live Chat with our Stimulsoft licensing specialists now.