FastReport Business Graphics .NET 2022.1

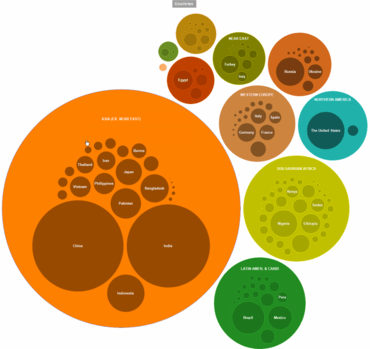
Adds the ability to build interactive, hierarchical bubble charts.
April 8, 2022
New Version

Features

  • Added the ability to build interactive, hierarchical bubble charts.
    • A 'bubble' chart helps visualize hierarchical data as circles that have an area proportional to the value of the record. Inside parent records, child records can be nested.
    • The visualization depth of the hierarchical data can be easily adjusted.
    • The appearance of the chart can be changed in code or directly in the chart style editor.
    • The library also contains predefined color palettes.
  • Improved MainDemo interface and added new planets dataset.
  • Updated documentation.
Example bubble chart

FastReport Business Graphics .NET

Data visualization library for .NET WinForms.

Got a Question?

Live Chat with our Fast Reports licensing specialists now.