Stimulsoft 2023.2.1

Adds new Dark theme for WinForms applications along with improved watermark design support.
March 28, 2023
New Version

Features

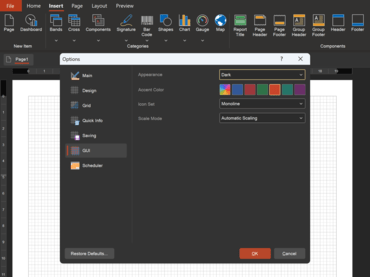
  • Dark theme - The desktop application and runtime components - the designer and viewer for WinForms applications - adds dark theme support.
  • New icons in UI - The Stimulsoft BI Designer desktop application and runtime components, including the designer and viewer for WinForms applications, can now choose between two distinct icon sets - Monoline or Regular.
  • Compilation for Microsoft .NET 6 and .NET Framework 4.7.2 - This release adds separate compilation using .NET Framework 4.7.2 and .NET 6.0. This new feature allows users to take advantage of the latest library updates.
  • The Watermark Style - This feature enables users to create customized watermark designs and apply them to report pages and dashboards.
  • Java 11+ and Jakarta - Reports.JAVA now supports Java 11+ platform and Jakarta namespace.
  • Styles for elements - For the dashboard 'Text', 'Image' and 'Panel' elements you now can apply a style to customize the design.
  • Angular 13 - Reports.ANGULAR has been upgraded to utilize the latest version of Angular.
  • Automatic switching between dashboards - You can define the time interval for switching using the 'Scroll Time' report template property. The value you set will determine how many seconds the viewer will wait before switching to the next tab.
  • Indicators in charts - Doughnut chart now allows you to display indicators. The chart indicator can either be a value or an expression of the chart.
  • Update of nullable types in variables - The null control is now integrated into the variable value field. If the checkbox is checked, the variable returns the specified value. If the checkbox is unchecked, then the variable returns null.
  • New custom format - This format allows you to highlight value ranges without having to apply conditional formatting.
  • Setting up grids in dashboards - When designing dashboards, alignment and docking of elements are often done using a grid. This release adds the ability to change grid spacing when creating or editing a dashboard.
  • PostgreSQL in Stimulsoft BI Server - Now you can choose to store your server data in a PostgreSQL database. You can easily switch between databases in the Stimulsoft Controller.
  • Options tab in Stimulsoft BI Server - This tab includes various settings that allow you to customize the functionality of Stimulsoft BI Server.
  • New features in the Publish Wizard
    • Support for ASP.NET Razor, .NET 7, Angular 14 and 15.
    • Exporting reports now includes the option to save a ZIP archive with images.
  • Chart and cross-tab globalization - Fields can now be localized depending on the report culture.
  • User Options - Stimulsoft BI Server now offers a new feature allowing users to create parameters for their roles, workspaces, and even transfer them to reports.
  • Links in Stimulsoft BI Server - With this new feature, creating a Link element and specifying a report or dashboard will launch it when the link is activated. This means that users can now access reports and dashboards in different folders of the workspace.
  • New functions
    • VLookup() and VLookupStr() which allow users to search for a data string based on a value from the first column and return the value of the second column from the same row.
    • StDev() and StDevP() aggregate functions enable users to calculate the estimated standard deviation for a sample or population.
    • Random() function can generate a random number between 0 and 1.
    • FontValue() function provides users with the ability to create a custom font with specified parameters to be applied through an expression.
    • ToJapaneseDateString() enables the conversion of DateTime data to a Japanese calendar string, with formatting options supported.
  • New dashboard events - The latest release introduces two new events for dashboards: BeginRender and Refreshing. These events provide users with more control over their dashboards, allowing them to define a script that will run either before the dashboard is built or each time it is updated.
  • Font via expression - This release adds the ability to use expressions as the value of the Font property for 'Text' and 'Text in Cells' report components.
  • New features in dashboard filtering elements - It is now possible for the List Box element to display a list of values as a radio list. New properties SelectedValue, SelectedLabel, and SelectedIndex for filtering elements have been added.
  • New Data Bar features in Dashboards - In the new release the design settings for histograms have been significantly expanded. With the new Maximum and Minimum value properties, users can now set the range of rendering for the histogram graphic element. Additionally, users can specify the histogram color for positive and negative values.
  • Sorting in the dashboard chart - Previously, sorting in a chart was limited to columns of values, arguments and series. With the new 'Sort by' field users can now specify a data column for sorting.
  • Additional chart options
    • A new property called 'Series Border Color' has been added to the chart style. This property allows you to define the color of the borders of the chart's graphic elements.
    • Added the ability to display graphical elements side by side or behind for three-dimensional column charts in reports.
    • A new property called 'Bubbles Scale' has been added for the Bubbles type chart in reports. This property lets you change the scale of graphic elements.
  • New features for Pivot Table - You can now toggle the visibility of data columns in the pivot table. This new capability also allows for conditional formatting on the values of a data column that is not displayed in the pivot table.
  • Relations in an OData data source - It is now possible to create links between different data sources obtained through the Open Data Protocol.
  • Connection string editor for PostgreSQL, MySQL and MariaDB - You can access the connection string editor by clicking on the Build control in the New Connection window.
  • New features for Half-Circular Gauge - You can now display gauge value labels within reports.
  • Enhanced work with Conditions - You can now easily copy and paste conditions for components from the clipboard.
  • Copying Data Dictionary elements - Using the Copy/Paste commands from the context menu or the Ctrl+C/Ctrl+V hotkeys, you can copy each element of the dictionary individually, as well as their category.
New Dark theme

Stimulsoft Ultimate

Render reports and dashboards in your applications.

Got a Question?

Live Chat with our Stimulsoft licensing specialists now.