Official Supplier
As official and authorized distributors, we supply you with legitimate licenses directly from 200+ software publishers.
See all our Brands.
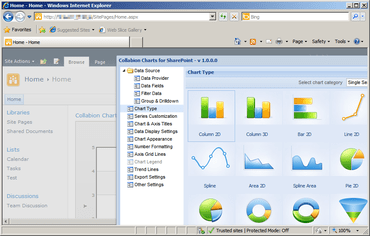
Collabion Charts for SharePoint lets you create insightful dashboards in SharePoint without MOSS or Excel Services. It works with WSS 3.0, MOSS 2007 and SharePoint Server 2010, and can plot charts from data stored in SharePoint lists, CSV, MS SQL Server, Oracle, Excel and BDC. The charts are rendered in JavaScript (HTML5), or Flash and work across all devices and platforms seamlessly. With the simple wizard-based installation, you can create your first dashboard in 15 minutes.
FusionCharts is a leading provider of Web applications and services with 20 years experience in Information Technology. They have identified Adobe Flash based Web applications as its focus area which enables them to create Rich Internet Applications that blend content, application logic and communications.

Live Chat with our Infosoft Global licensing specialists now.