Collabion Charts released

Easily add interactive chart web parts to your SharePoint dashboards.
July 13, 2012
Press Release

Collabion Charts lets you create insightful dashboards in SharePoint without MOSS or Excel Services. It works with WSS 3.0, MOSS 2007 and SharePoint Server 2010, and can plot charts from data stored in SharePoint lists, CSV, MS SQL Server, Oracle, Excel and BDC. The charts are rendered in JavaScript (HTML5), or Flash and work across all devices and platforms seamlessly. With the simple wizard-based installation, you can create your first dashboard in 15 minutes.  

Features

  • Renders in both JavaScript (HTML5) and Flash - Charts are rendered using JavaScript (HTML5) and Flash, and hence work on all major platforms, browsers and devices including iPhones and iPads
  • Reduce the Load on your Servers - All the charts are rendered on client-side
  • Filtering, Grouping and Drill-down - Logical, boolean and date filters can be specified on data sets to narrow down the data
  • Interactivity - Charts are highly interactive with tooltips, drill-downs, selective display of data and scroll & zoom capabilities
  • Easy to Use - No coding required at all, charts are created and edited using the visual wizard
  • Data Sources - Data can be retrieved from SharePoint Lists, Views, CSVs, MS SQL, Oracle, Excel & BDC
  • Customize - Visual aspects like fonts, colors, effects and animation of each element on the chart can be customized extensively using the wizard
  • Export - Export charts as images or PDFs
  • SharePoint Editions - Identical functionality across WSS 3.0, MOSS 2007 and SharePoint 2010, including Foundation Server, on Windows Server 2003 and 2008, without the need for Excel Services

About InfoSoft Global

InfoSoft Global is a leading provider of Web applications and services with 20 years experience in Information Technology. They have identified Adobe Flash based Web applications as its focus area which enables them to create Rich Internet Applications that blend content, application logic and communications.
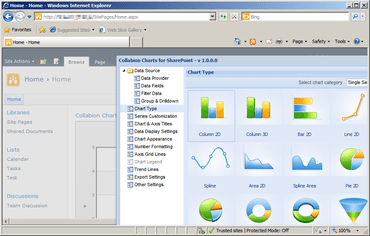
Charts created with Collabion Charts.

Got a Question?

Live Chat with our Infosoft Global licensing specialists now.