Official Supplier
As official and authorized distributors, we supply you with legitimate licenses directly from 200+ software publishers.
See all our Brands.
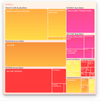
Description: Add Tree Map charts to your JavaScript apps. Vizuly Tree Map visualizes hierarchical data ... of the visualization. In addition to several different fill/stroke styles you can adjust the padding between and within ... Read more Show more results from this product
Screenshots: 0 ... Read more
Screenshots: 0 ... Read more

Description: Add charts and visualizations to your JavaScript apps. Vizuly Professional includes Corona, Halo, ... built-in dynamic runtime styles to make pixel perfect visualizations. Advanced users can use D3 ... with the Vizuly lifecycle hooks to create highly customized and unique visualizations. Features Corona Halo Radial ... Read more Show more results from this product
Licensing: Vizuly Professional Licensing Read more
Pricing: Vizuly Professional 2.1.207 1 Developer License- includes 1 Year of Updates and Premium Support Our Part No: 555753-1173909 5 Developer License- includes 1 Year of Updates and Premium Support Our Part No: 555753-1173911 10 Developer License- includes 1 Year of Updates and Premium Support Our Part ... Read more

Description: of targets. Vizuly Halo uses several different data visualization techniques to represent transactional ... as segmented arcs along the circumference of the visual, and targets are shown as clustered circles ... Read more Show more results from this product
Licensing: Vizuly Halo Licensing Read more
Pricing: Vizuly Halo 2.1.207 1 Developer License- includes 1 Year of Updates and Premium Support Our Part No: 555740-1173905 1 Developer 1 Year of Updates and Premium Support Renewal Our Part No: 555740-1173906 ... Read more
Description: and visual attributes unique to each set. Features 6 example themes Several dynamic styles Adjustable ... Read more Show more results from this product
Screenshots: 0 ... Read more
Screenshots: 0 ... Read more

Description: A radial line and area layout visualization. Vizuly Corona is a radial chart that provides angular ... Read more Show more results from this product
Pricing: Vizuly Corona 2.1.207 1 Developer License- includes 1 Year of Updates and Premium Support Our Part No: 555737-1173903 1 Developer 1 Year of Updates and Premium Support Renewal Our Part No: 555737-1173904 ... Read more
Licensing: Vizuly Corona Licensing Read more
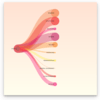
Description: Represent asymmetric hierarchical information in an easy to read visualization. Vizuly Weighted ... Read more Show more results from this product
Pricing: Vizuly Weighted Tree 2.1.207 1 Developer License- includes 1 Year of Updates and Premium Support Our Part No: 555739-1173933 1 Developer 1 Year of Updates and Premium Support Renewal Our Part No: 555739-1173934 ... Read more
Licensing: Vizuly Weighted Tree Licensing Read more
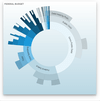
Description: Adds Sunburst charts to your JavaScript apps. Vizuly Sunburst is designed to represent hierarchical data in a radial plot. It supports drill down and drill up capabilities by allowing the user to collapse and expand segments of the sunburst when they click on that area. Features Supports Dynamic ... Read more Show more results from this product
Screenshots: 0 ... Read more
Screenshots: 0 ... Read more
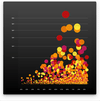
Description: Add Scatter Plot charts to your JavaScript apps. Vizuly Scatter Plot shows 3 dimensions of data at once by plotting values along both the x and y axis as well as the radius of the plot itself. Each plot can be colored and styled dynamically based on your data. Features Supports Dynamic Scales for ... Read more Show more results from this product
Screenshots: 0 ... Read more
Screenshots: 0 ... Read more
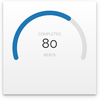
Description: Show numeric values within a minimum and maximum range. Vizuly Radial Progress is designed to show numeric values within a minimum and maximum range. It can also show when a value has exceeded the maximum threshold. This chart supports a variable range of start/stop angles, arc end caps, and comes ... Read more Show more results from this product
Screenshots: 0 ... Read more
Screenshots: 0 ... Read more
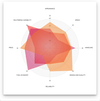
Description: Add Radar charts to your JavaScript apps. Vizuly Radar Chart graphs multiple dimensions of one datum along multiple radial axis. Each plot represents 3 or more data points along shared axis lines. This chart supports highlighting of both individual data points and the group as a whole. Features ... Read more Show more results from this product
Screenshots: 0 ... Read more
Screenshots: 0 ... Read more