Components / Codejock Software / Accusoft - Best Selling

  1. Screenshots: Create applications with Microsoft Office style Ribbon Bar. 0 ... Read more Show more results from this product

  2. Screenshots: Provides Windows developers with a sophisticated Outlook style Calendar. ... Read more

  3. Screenshots: Easily create, group and sort data in a flat or hierarchical format. ... Read more

  4. $$$ | Buy

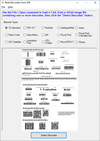
    Screenshots: Barcode Xpress reads most commonly used 1D barcodes, detecting them anywhere on the page, in any orientation. 0 ... Read more Show more results from this product

  5. Screenshots: Barcode Xpress accurately reads common industry 1D and 2D barcodes and also writes most 1D barcodes and many 2D barcodes. 0 ... Read more

  6. Screenshots: Report confidence values for detected barcodes. 0 ... Read more

  7. Screenshots: Complete set of Office controls including shortcut bar and report grid. ... Read more Show more results from this product

  8. Screenshots: The latest design and visual styles are available including Visual Studio style docking stickers. ... Read more

  9. Screenshots: Sophisticated docking algorithms provide endless layouts and possibilities for presenting your data and organizing your application desktop. ... Read more

  10. 4. PDF Xpress .NET Buy Now

    Brand: Accusoft
    Primary Category: PDF Components
    $$$ | Buy

    Screenshots: PDF Xpress supports extracting text content from PDF pages and reporting contextual information for specific words. Use PDF Xpress to report the counding quadrilaterals and surrounding words for any whole or partial word extracted from the pages of a PDF ... Read more Show more results from this product

  11. Screenshots: PDF Xpress allows you to add an image to a specific page in a PDF document. 0 ... Read more

  12. Screenshots: PDF Xpress allows you to convert PDF documents to image formats such as Windows Bitmap, Sequential JPEG, Multi-Page TIFF (JPEG) and Multi-Page DCX. 0 ... Read more

  13. $$$$$ | Buy

    Screenshots: 0 ... Read more Show more results from this product

  14. Screenshots: 0 ... Read more

  15. $$$$$ | Buy

    Screenshots: Understanding PrizmDoc Read more Show more results from this product

  16. Screenshots: Document Viewing- PPTX Read more

  17. Screenshots: Document Viewing- DOC Read more

  18. Screenshots: Display a "conventional style" calendar by month when using month view. 0 ... Read more Show more results from this product

  19. Screenshots: Several appointments with an assortment of labels. ... Read more

  20. Screenshots: Add appointments that occur at a specific interval of days. 0 ... Read more

  21. Screenshots: Display a "conventional style" calendar by month when using month view. 0 ... Read more Show more results from this product

  22. Screenshots: From this dialog you can set the time, recurrence, label, category, even set a reminder. ... Read more

  23. Screenshots: Add appointments that occur at a specific interval of days. 0 ... Read more

  24. Screenshots: A pie chart displays a series of data as "slices" of a "pie". The data in the pie chart will be divided up into slices, each represents a percentage of the pie. The size of the slice will be proportional to the data it represents and ... Read more Show more results from this product

  25. Screenshots: A bar chart displays data with rectangular "bars" with lengths relative to the data they symbolize. Generally a bar chart is used to display discontinuous data (data that has a discrete value), however it can also be used for continuous data. ... Read more

  26. Screenshots: An area chart is very similar to a line chart. Data is displayed using different colors in the "area" below the line. Each series of points is represented with a different color. Area charts are commonly used to display accumulated values over a ... Read more

  27. Screenshots: A bubble chart is just a variation of a point chart, only it displays bubbles of the data points. Data in displayed in a grid using Cartesian coordinates. Data is displayed along the x and y axis, where x and y can represent any type of data. ... Read more Show more results from this product

  28. Screenshots: A Stacked Area chart is very similar to an area chart. Data is displayed using different colors in the "area" below the line. Each series of points is represented with a different color. Area charts are commonly used to display accumulated ... Read more

  29. Screenshots: A pie chart displays a series of data as "slices" of a "pie". The data in the pie chart will be divided up into slices, each represents a percentage of the pie. The size of the slice will be proportional to the data it represents and ... Read more