資料視覺化元件







最新新聞
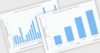
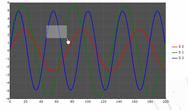
Navigate Large Datasets with Chart Scrolling
July 27, 2026功能焦點
Explore extensive datasets with horizontal and vertical chart scrolling, improving readability while providing quick access to detailed insights.
Trigger Actions with Button Cell Types
July 27, 2026功能焦點
Simplify grid interactions with button cell types that provide quick access to frequently used commands without leaving the grid.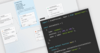
更自然地構建 React 關係圖
July 23, 2026Product Update
JointJS+ v4.3.0 引入了React 集成,可以更輕鬆地構建、維護和擴展互動式圖表應用。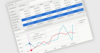
用樞紐分析圖視覺化複雜資料
July 21, 2026功能焦點
創建互動式樞紐分析圖,以視覺化匯總資料、發現趨勢並支援有效的資料分析。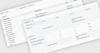
將網格資料組織成有意義的群組
July 20, 2026功能焦點
將相關紀錄分組為邏輯區塊,方便瀏覽資料、比較數值並識別有意義的趨勢。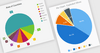
在 Vue.js 應用程式中構建互動式圓形圖
July 20, 2026功能焦點
透過具有工具提示、圖例、標籤和動畫等特性的回應式圓形圖視覺化類別比例。



 (2)
(2)

 (3)
(3)