LightningChart Python
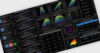
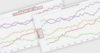
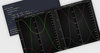
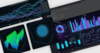
一個高性能、GPU 加速的 2D 和 3D 資料視覺化庫,用於資料科學和軟體開發 Python 應用程式。
由以下開發商製作:LightningChart
ComponentSource 開始代理銷售的日期:2021年
一個高性能、GPU 加速的 2D 和 3D 資料視覺化庫,用於資料科學和軟體開發 Python 應用程式。
由以下開發商製作:LightningChart
ComponentSource 開始代理銷售的日期:2021年

聯繫電話: (888) 850 9911
傳真: +1 770 250 6199