Build Reports Faster with AI Assistance
July 10, 2025Product Update
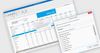
DevExpress Reporting v25.1 adds a new Report Wizard that uses natural language input to automatically build report layouts.
Tel: (888) 850 9911
Fax: +1 770 250 6199