


Official Supplier
As official and authorized distributors, we supply you with legitimate licenses directly from 200+ software publishers.
See all our Brands.
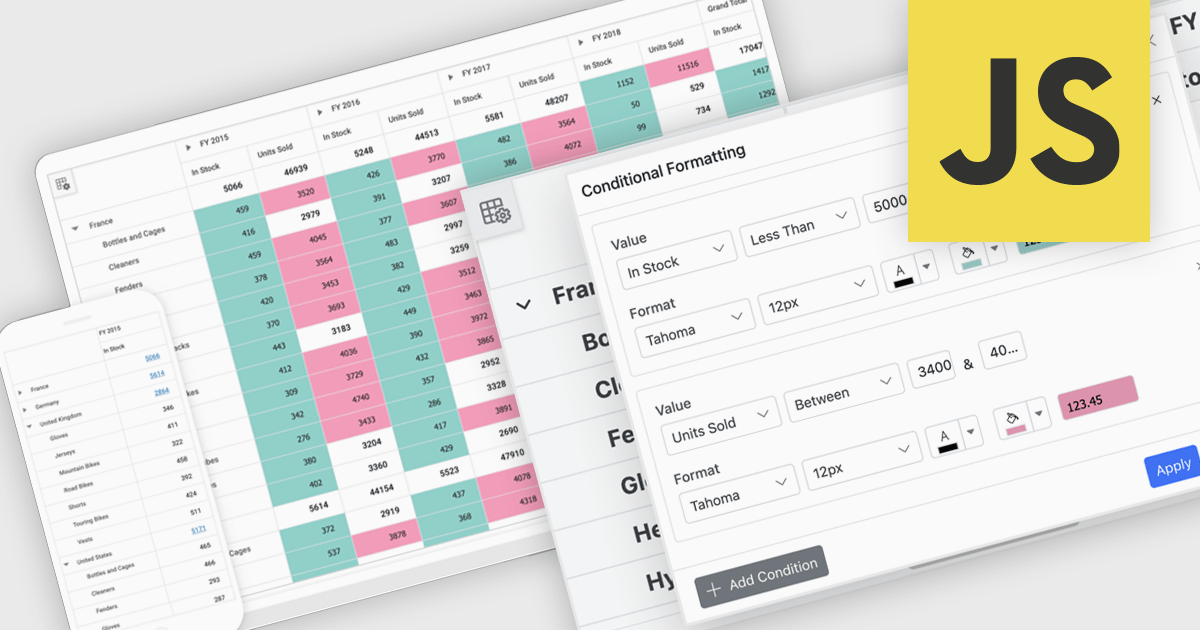
A pivot grid is a powerful data analysis tool that lets users quickly organize and summarize large datasets by rearranging rows, columns, and values. It simplifies reporting by allowing users to group, filter, and aggregate data to uncover patterns and trends. Pivot tables improve clarity, reduce manual calculations, and support flexible data exploration. Common use cases include analyzing sales by product or region, tracking departmental budgets, and creating summary reports for decision making.
Several JavaScript UI suites offer pivot grid components including:
For an in-depth analysis of features and price, visit our comparison of JavaScript UI suites.


Tel: (888) 850 9911
Fax: +1 770 250 6199


