Manage Projects in your Blazor App

November 28, 2023
Provide users with a Gantt chart, offering a clear and concise overview of project timelines, dependencies and progress.

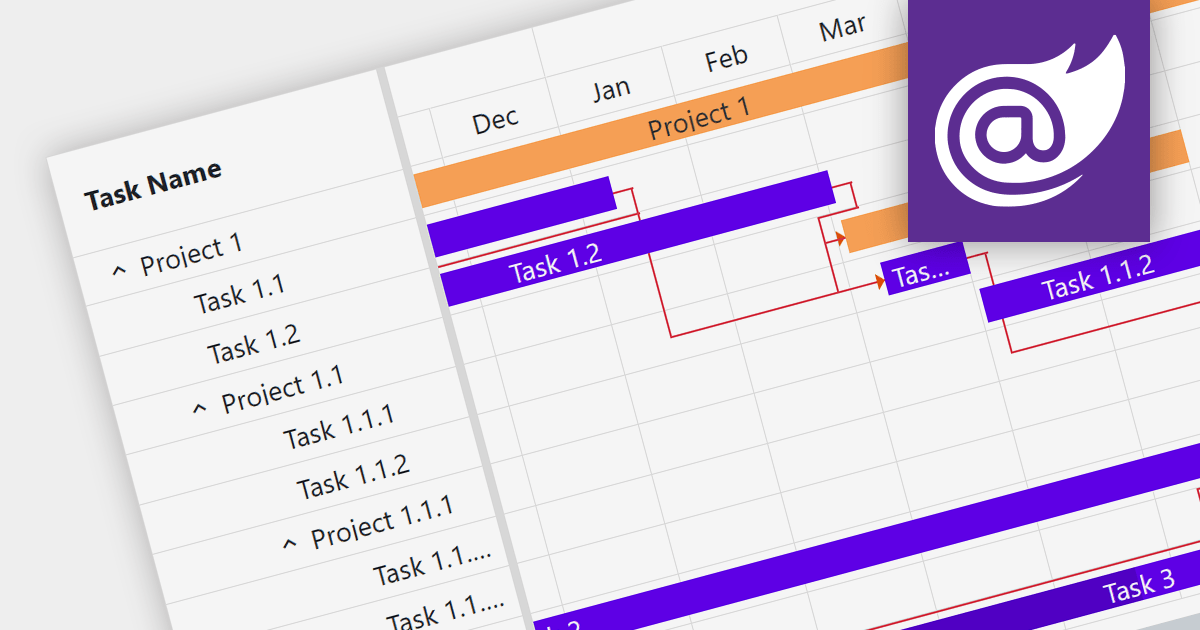
Gantt charts are a type of bar chart designed to illustrate project schedules. They display the start and end dates of different elements of a project and are essential for project management. These charts are useful for tracking project progress and for planning by showing how project tasks overlap and relate to each other.

Several Blazor chart components provide Gantt charts including:

  • ComponentOne Charts for Blazor (part of ComponentOne Studio Blazor Edition by MESCIUS) includes powerful and customizable Gantt charts for Blazor applications.
  • Telerik Blazor Chart (part of Telerik UI for Blazor) displays feature-rich Gantt charts with interactive data visualization capabilities.
  • Syncfusion Blazor Chart (part of Syncfusion Essential Studio Enterprise) comes with comprehensive Gantt charts with native Blazor support.
  • Smart HTML Elements Blazor Chart (part of Smart HTML Elements) provides easy-to-use Gantt charts for creating modern Blazor UIs.
  • TeeChart Blazor (part of by TeeChart .NET for Blazor by Steema Software) includes versatile Gantt charts with a wide range of customization options.

For an in-depth analysis of features and price, visit our Blazor Charts comparison.

Compare Blazor Charts